- USD/JPY Price Analysis: Bulls meeting tough resistance from bears despite bull flag
Market news
USD/JPY Price Analysis: Bulls meeting tough resistance from bears despite bull flag
- It is make or break time for USD/JPY at this juncture.
- The price is meeting resistance despite the bullish flag.
USD/JPY is meeting an area of resistance on the hourly chart and has struggled to make a clean break out from the daily bull flag. Instead, the bears are targeting the W-formation's neckline and a break thereof will open the risk of a significant correction for the foreseeable future. The following illustrates this on a daily and weekly chart.
USD/JPY weekly chart
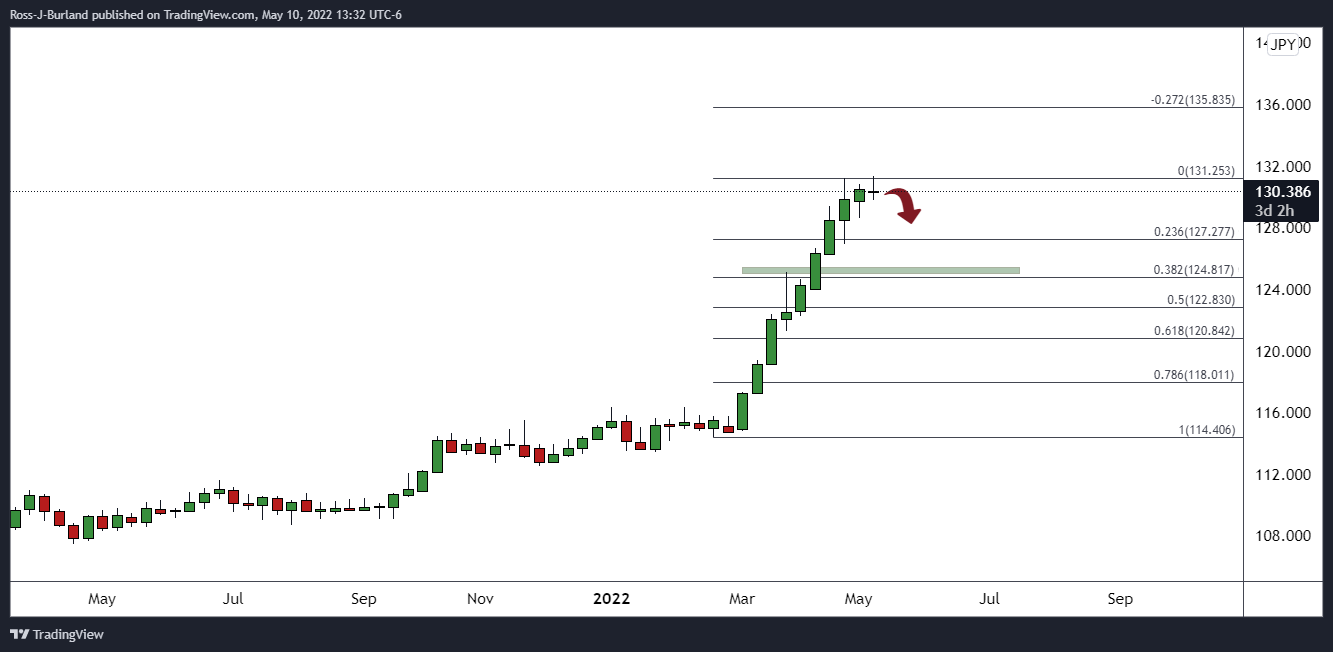
The price has made nine consecutive bullish weekly closes and a doji left on this week's candle could be the signal to the bears to keep the pressure on. A correction to the 38.2% Fibonacci level requires a break of the psychological 125 figure.
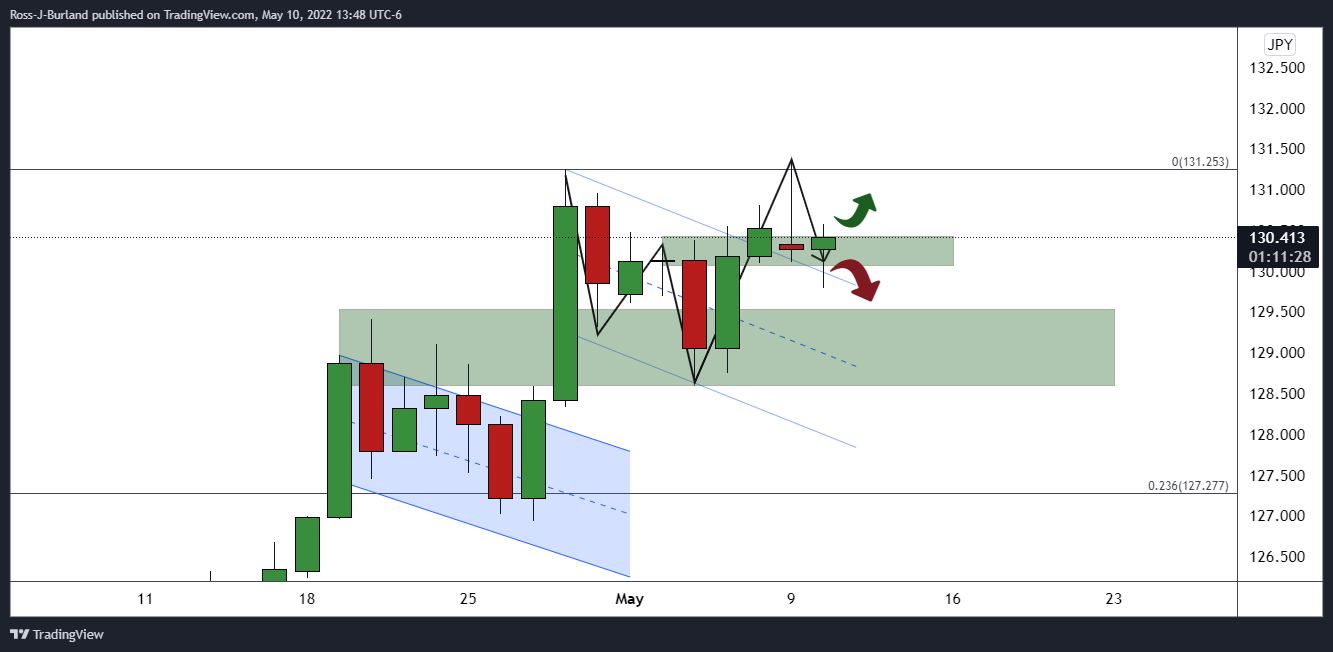
USD/JPY daily chart
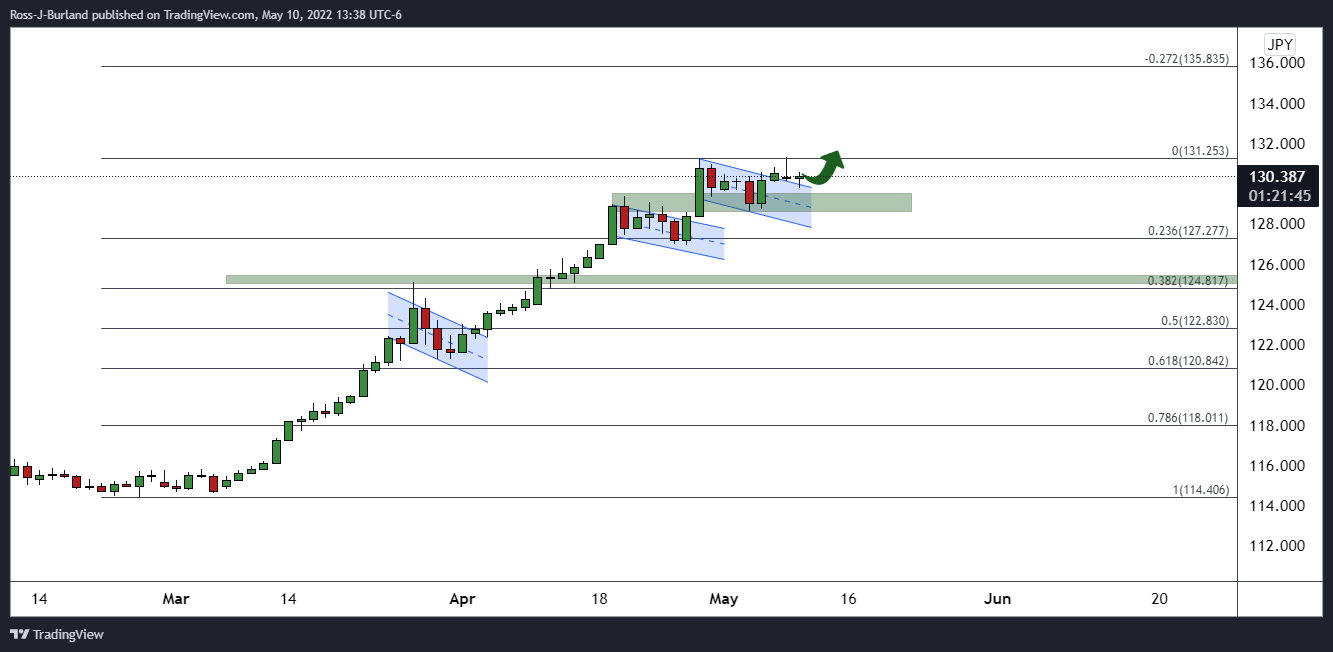
The series of bullish flag patterns is a compelling feature on the chart but the price's breakout is not convincing at this juncture. Instead, the bears are putting up resistance and on closer inspection, the W-formation may be playing a role in the inability to breakout: