- GBP/JPY Price Analysis: Will a head-and-shoulders in the daily chart push the price towards 152.00?
Market news
GBP/JPY Price Analysis: Will a head-and-shoulders in the daily chart push the price towards 152.00?
- On Tuesday, the GBP/JPY recorded minimal gains of 0.01%.
- As the Asian session begins, the market mood remains mixed, so beware of sudden JPY strength, despite the Bank of Japan’s commitment to ultra-loose monetary policy.
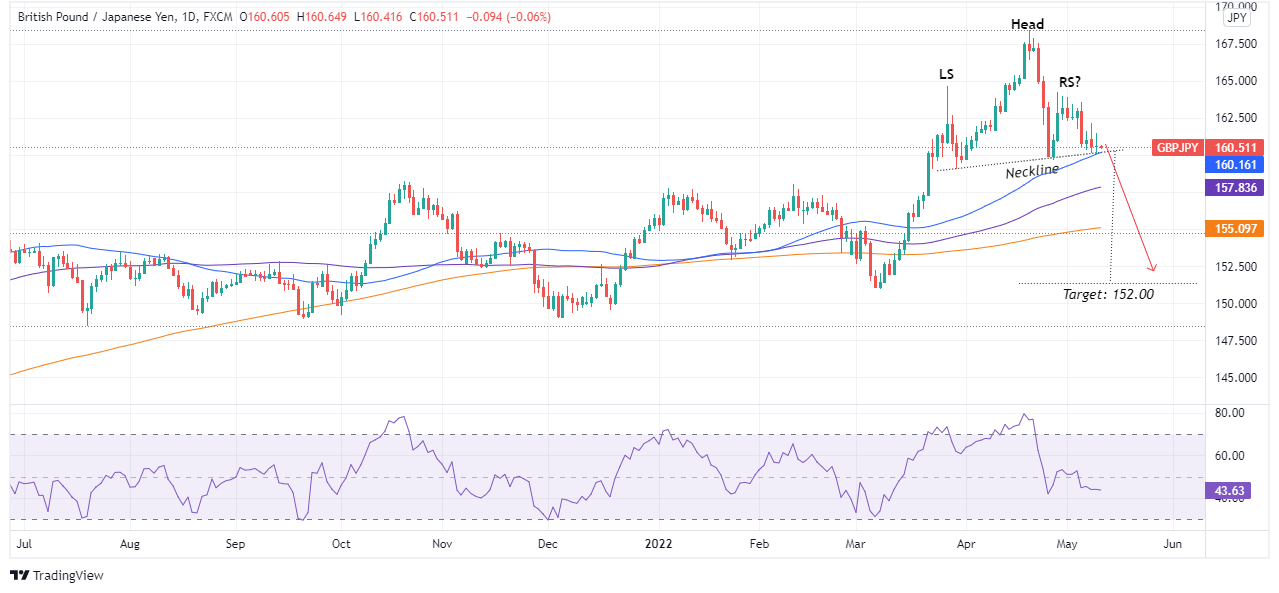
- GBP/JPY Price Forecast: The confirmation of a head-and-shoulders chart pattern would send the pair tumbling toward 152.00.
The GBP/JPY pares some of Monday’s losses though formed a doji in the daily chart, as traders remain undecided to push prices below the 160.00 mark or upwards to the 20-day moving average (DMA) at 163.16 in the Asian session. At the time of writing, the GBP/JPY is trading at 160.51.
Sentiment remains mixed as Asian equity futures fluctuate before the Sydney open. Fed speakers favored 50-bps rate hikes in the Federal Funds Rate (FFR) in the US session as inflation figures to be released on Wednesday loom. Also, higher US Treasury yields and China’s coronavirus crisis restrictions threaten to disrupt the global economic recovery.
That said, in the overnight session, the GBP/JPY opened near the 160.59 area and dipped near the daily lows around 160.00. nevertheless, during the European session, the cross-currency pair reached a daily high at 161.51, depicting a 150-pip range in the day. However, at the end of the trading session, a doji in the daily chart depicts that buying and selling pressure is at equilibrium.
GBP/JPY Price Forecast: Technical outlook
Despite the aforementioned in the paragraph above, a head-and-shoulders chart pattern looms. The Relative Strength Index (RSI), around 43.77, is in bearish territory, but the GBP/JPY remains range-bound.
If that scenario plays out, and the GBP/JPY breaks below the neckline, around 160.20-30, the first support would be the 100-day moving average (DMA) at 157.83. Breach of the latter would expose the 200-DMA at 155.09, followed by the head-and-shoulders chart pattern target around 152.00.
Key Technical Levels