- AUD/USD Price Analysis: Longer-term 'Shorts' eye a run to June 2020 lows, 0.6776
Market news
11 May 2022
AUD/USD Price Analysis: Longer-term 'Shorts' eye a run to June 2020 lows, 0.6776
- AUD/USD bulls have stepped in below a critical support area.
- However, bears are seeking a run to the June 2020 lows of 0.6776.
The daily chart is showing the price below key daily support, and prior lows, yet the prior day's doji means that there are prospects of a correction. The prior January daily lows are the first hurdle before the May 2 lows which guard a correction to the 38.2% Fibonacci level.
AUD/USD daily chart
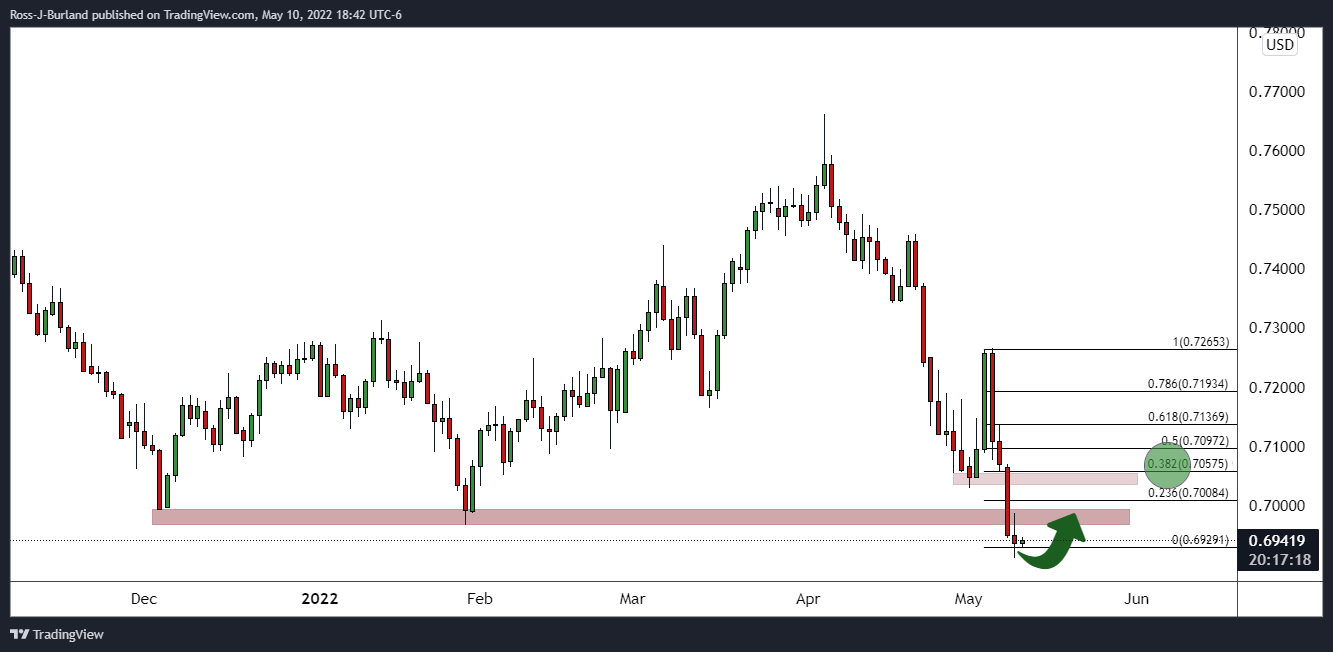
With that being said, a bullish engulfing candle in the next day or two would be required to confirm the corrective bias.
AUD/USD weekly chart
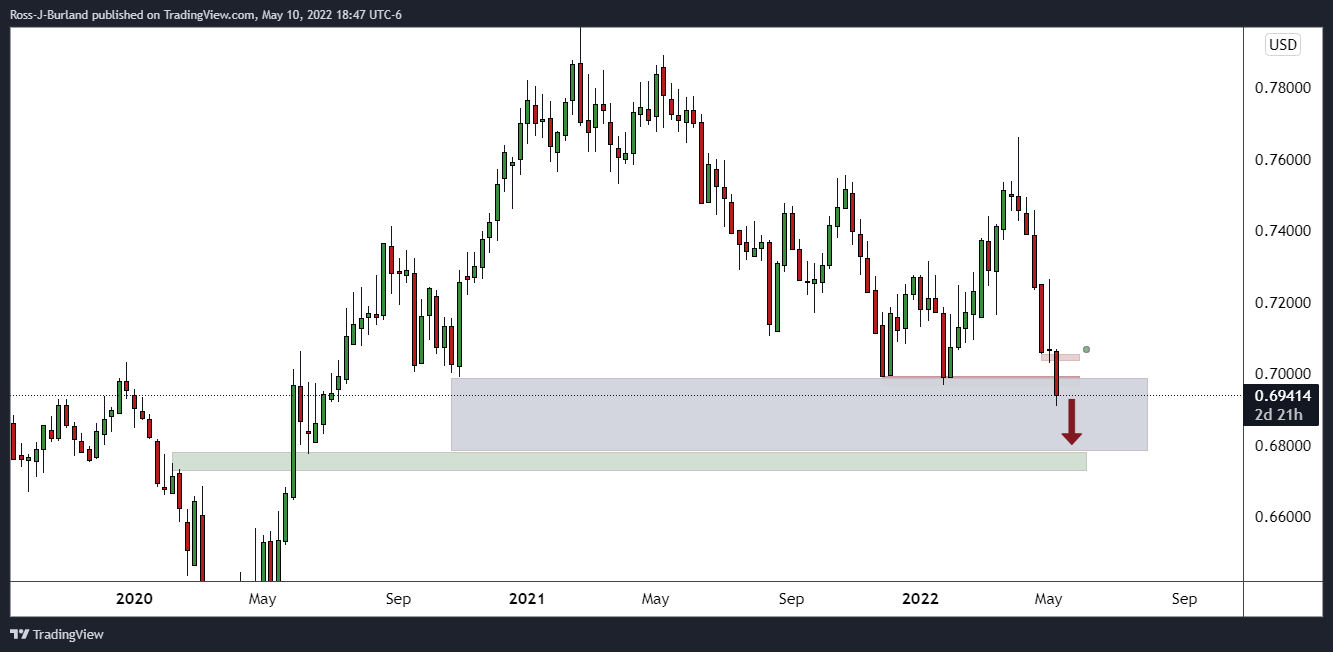
From a weekly perspective, however, the price is showing no signs of corrective behaviour and the focus is on mitigating the price imbalance between the 0.7000 figure all the way down to June 2020 lows of 0.6776.
Market Focus
Open Demo Account & Personal Page