- WTI Price Analysis: Retreats from weekly resistance line around $110.00
Market news
WTI Price Analysis: Retreats from weekly resistance line around $110.00
- WTI takes offers from a one-week-old trend line hurdle to pare intraday gains.
- Convergence of the 200-HMA, 100-HMA restricts immediate downside.
- Bullish RSI divergence, sustained bounce off 61.8% Fibonacci retracement favors buyers.
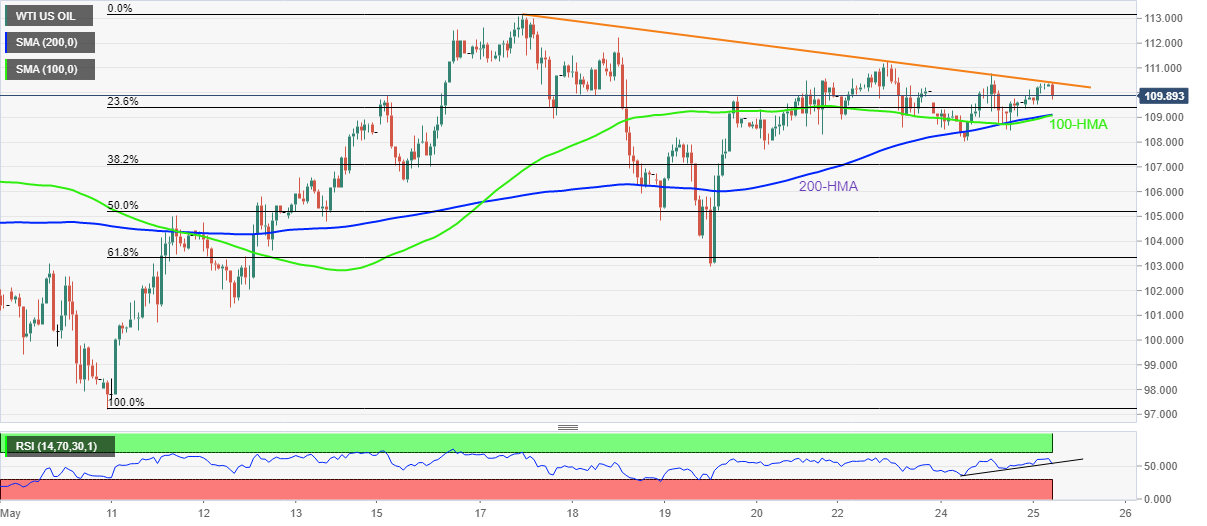
WTI takes a U-turn from the weekly resistance line while consolidating the daily gains around $109.80, up 0.20% intraday heading into Wednesday’s European session. In doing so, the black gold justifies a pullback in the RSI line.
However, the 100-HMA and 200-HMA confluence of around $109.00 appears a tough nut to crack for the oil sellers. Also challenging the WTI bears is the immediate ascending trend line on RSI (14), suggesting gradually firming bullish momentum.
Also acting as the key downside support is the 61.8% Fibonacci retracement of May 10-17 upside, near $103.30, as well as the $100.00 psychological magnet.
Meanwhile, a clear upside break of the weekly resistance line, at $110.50 by the press time, needs validation from $111.30 to challenge the monthly high surrounding $115.50.
It’s worth noting that late March’s peak near $116.60 acts as an additional upside filter before directing the WTI crude oil prices towards the yearly high of $129.42.
WTI: Hourly chart
Trend: Further upside expected