- USD/CHF Price Analysis: Range-bound around the 0.9570s-0.9660s area
Market news
USD/CHF Price Analysis: Range-bound around the 0.9570s-0.9660s area
- The USD/CHF continues extending its two-week rally, gaining 1.53%.
- Risk appetite increased and weighed on the USD/CHF, falling 0.15%.
- USD/CHF Price Forecast: In the short-term, to persist downward biased.
The USD/CHF records minimal losses for the third day in the week, though it clings above the 0.9600 mark, just above the 50-day moving average (DMA) at 0.9562. At the time of writing, the USD/CHF is trading at 0.9596.
A risk-on market mood keeps the greenback on the defensive. European bourses finished Thursday’s session with gains, while US equities are gaining. The US Dollar Index, a measure of the buck’s value vs. a group of peers, is falling 0.10%, sitting at 101.970.
Elsewhere, the USD/CHF appears to found its feet after dropping from YTD highs at 1.0000 towards 0.9600. For two consecutive days, the major has been trading within the 0.9573-0.9642 band, unable to break above/below the range, despite some US economic data that investors ignored.
From a technical analysis perspective, the USD/CHF remains in an uptrend, and it’s worth noting that the price action of the last three days formed a “bullish-harami,” a reversal candle-chart pattern.
During the day, the USD/CHF began trading near 0.9606 and so far has seesawed around the 0.9585-0.9632 range. Of late, it stabilized around 0.9600 as market players prepare for Friday’s Personal Consumption Expenditure (PCE), the Federal Reserve’s preferred measure for inflation.
USD/CHF Price Forecast: Technical outlook
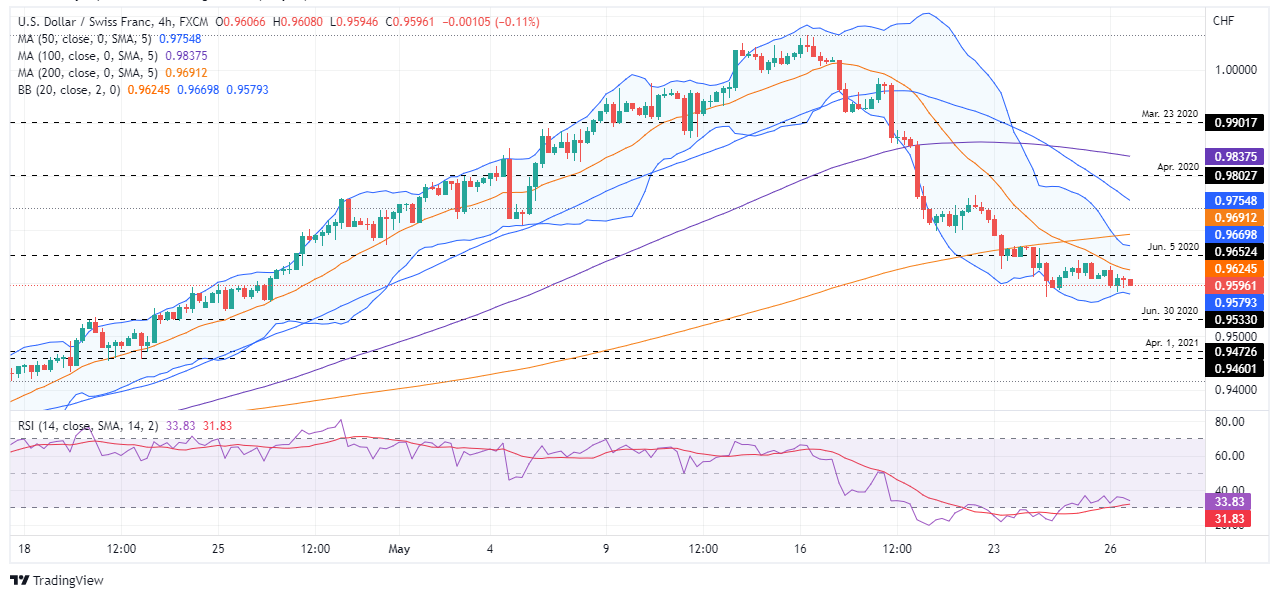
Volatility in the USD/CHF shrank, as shown by the Bollinger bands, in the 4-hour chart, depicting a trading range of 0.9579-0.9669. However, a continuation to the downside remains in play in the short term, as the 20, 50, 100, and 200-4H simple moving averages (SMAs) reside above the spot price, leaving the major vulnerable to additional selling pressure.
That said, the USD/CHF first support would be Bollinger’s bottom band at 0.9579. Break below would expose the June 30, 2020 highs at 0.9533, followed by March 16 swing high-turned-support at 0.9460.
Key Technical Levels