- Gold Price Forecast: XAUUSD wavers in range around $1,850, levels to watch – Confluence Detector
Market news
Gold Price Forecast: XAUUSD wavers in range around $1,850, levels to watch – Confluence Detector
- Gold Price is struggling around the $1,850 area amid risk-off markets.
- Record high inflation rate in the Euro area re-ignites growth concerns.
- USD holds the bounce with yields, XAUUSD’s range play likely to extend.
Gold Price is adding to the previous losses while keeping its range around the $1,850 psychological level. The precious metal feels the heat from a broad US dollar rebound amid a sharp upturn in the Treasury yields. Markets remain in a risk-off mode, underpinning the dollar’s haven demand. The ongoing upsurge in oil prices and record-high inflation in the Euro area have re-ignited global growth worries, as central banks remain on a tightening spree. Against this backdrop, gold price is finding some comfort, limiting its move lower. Traders now look forward to the US Nonfarm payrolls release for a fresh direction in XAUUSD.
Also read: Gold Price Forecast: XAUUSD looks south amid firmer yields, 200-DMA at risk?
Gold Price: Key levels to watch
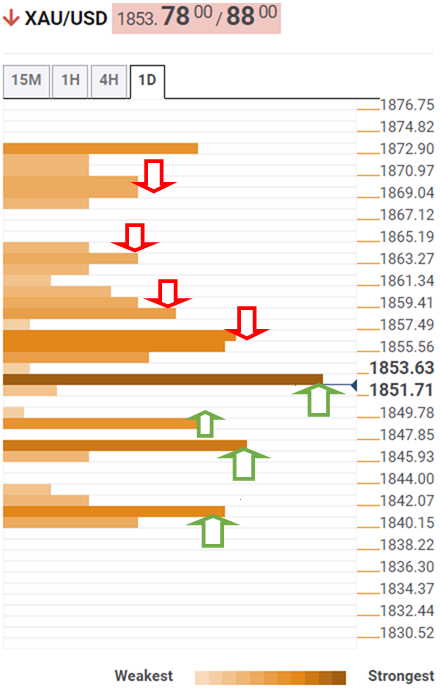
The Technical Confluences Detector shows that the Gold Price is gyrating around the $1,851 critical barrier, which is now acting as strong support. That price is the convergence of the Fibonacci 61.8% one-week, SMA50 four-hour and the pivot point one-day S1.
If that breaks then the next safety net appears at the pivot point one-day S2 at $1,848.
Further south, the pivot point one-month S1 at $1,846 will challenge the bullish commitments.
The last line of defense for gold bulls is seen at $1,841, the confluence of the SMA200 one-day, the previous week’s low and the pivot point one-week S3.
On the upside, bulls need a firm break above the $1,856 supply zone, where the SMA5 one-day, Fibonacci 23.6% one-day and the previous high four-hour collide.
The next bullish target is aligned at $1,859, the Fibonacci 38.2% one-day and one-week.
The Fibonacci 23.6% one-week at $1,863 will guard the additional upside, opening doors for a test of the previous week’s high of $1,870.
Here is how it looks on the tool
About Technical Confluences Detector
The TCD (Technical Confluences Detector) is a tool to locate and point out those price levels where there is a congestion of indicators, moving averages, Fibonacci levels, Pivot Points, etc. If you are a short-term trader, you will find entry points for counter-trend strategies and hunt a few points at a time. If you are a medium-to-long-term trader, this tool will allow you to know in advance the price levels where a medium-to-long-term trend may stop and rest, where to unwind positions, or where to increase your position size.