- EUR/USD Price Analysis: Bears are stalling bullish advances at key resistance, 50% mean reversion eyed
Market news
EUR/USD Price Analysis: Bears are stalling bullish advances at key resistance, 50% mean reversion eyed
- EUR/USD bears are lurking below a critical resistance.
- A break of 4-hour support could open the risk of a significant correction.
EUR/USD is displaying a bearish bias on the weekly chart which can be analysed on a lower time frame for prospects of a deeper correction in the days ahead. The following illustrates the market structure on a multi-timeframe basis:
EUR/USD weekly chart
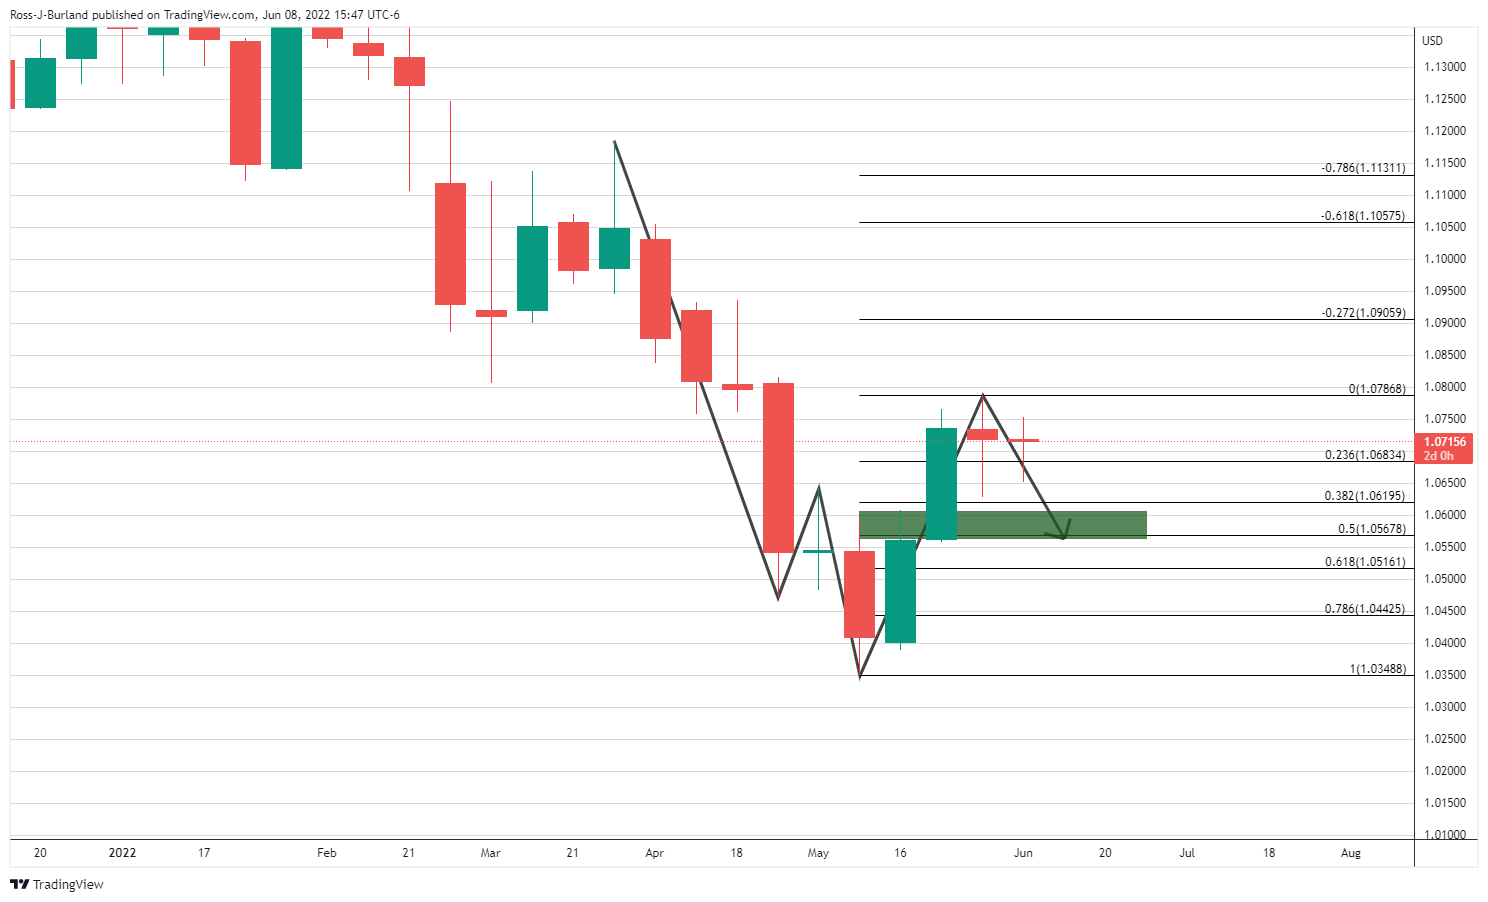
This is a powerful reversion pattern and a move in to test the old support, or the nose of the W-formation, is a high probability.
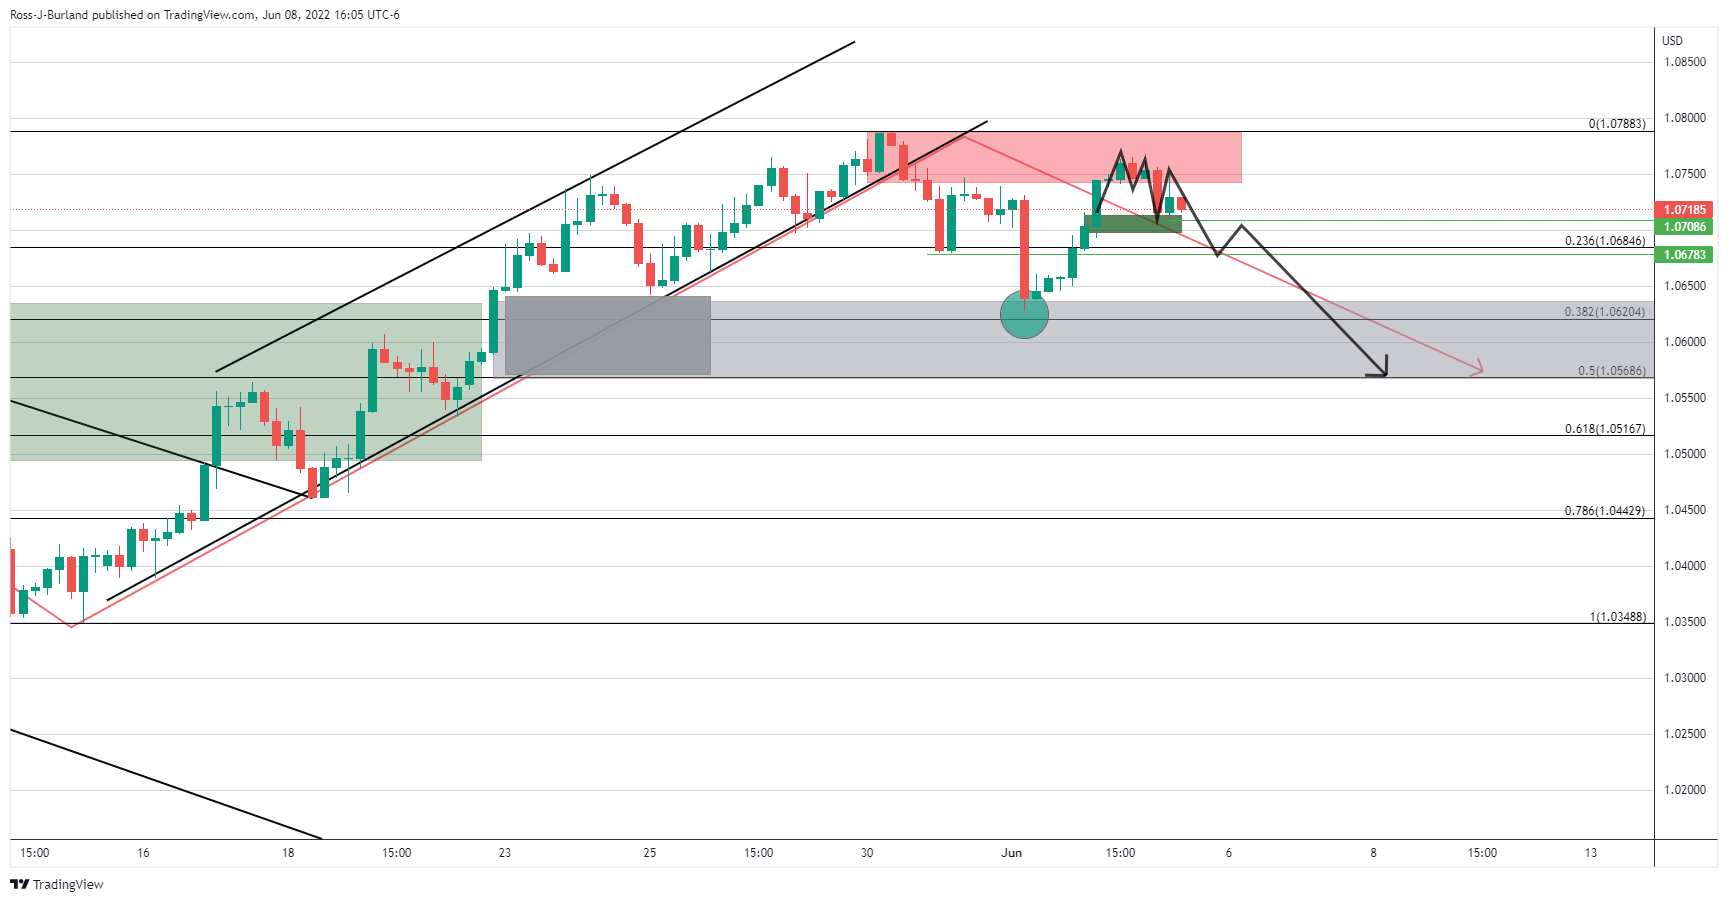
EUR/USD lower time frames, H1 & H4
On the lower time frames is where the current market structure and the potential distribution schematic that can be analysed for a bearish trade set-up
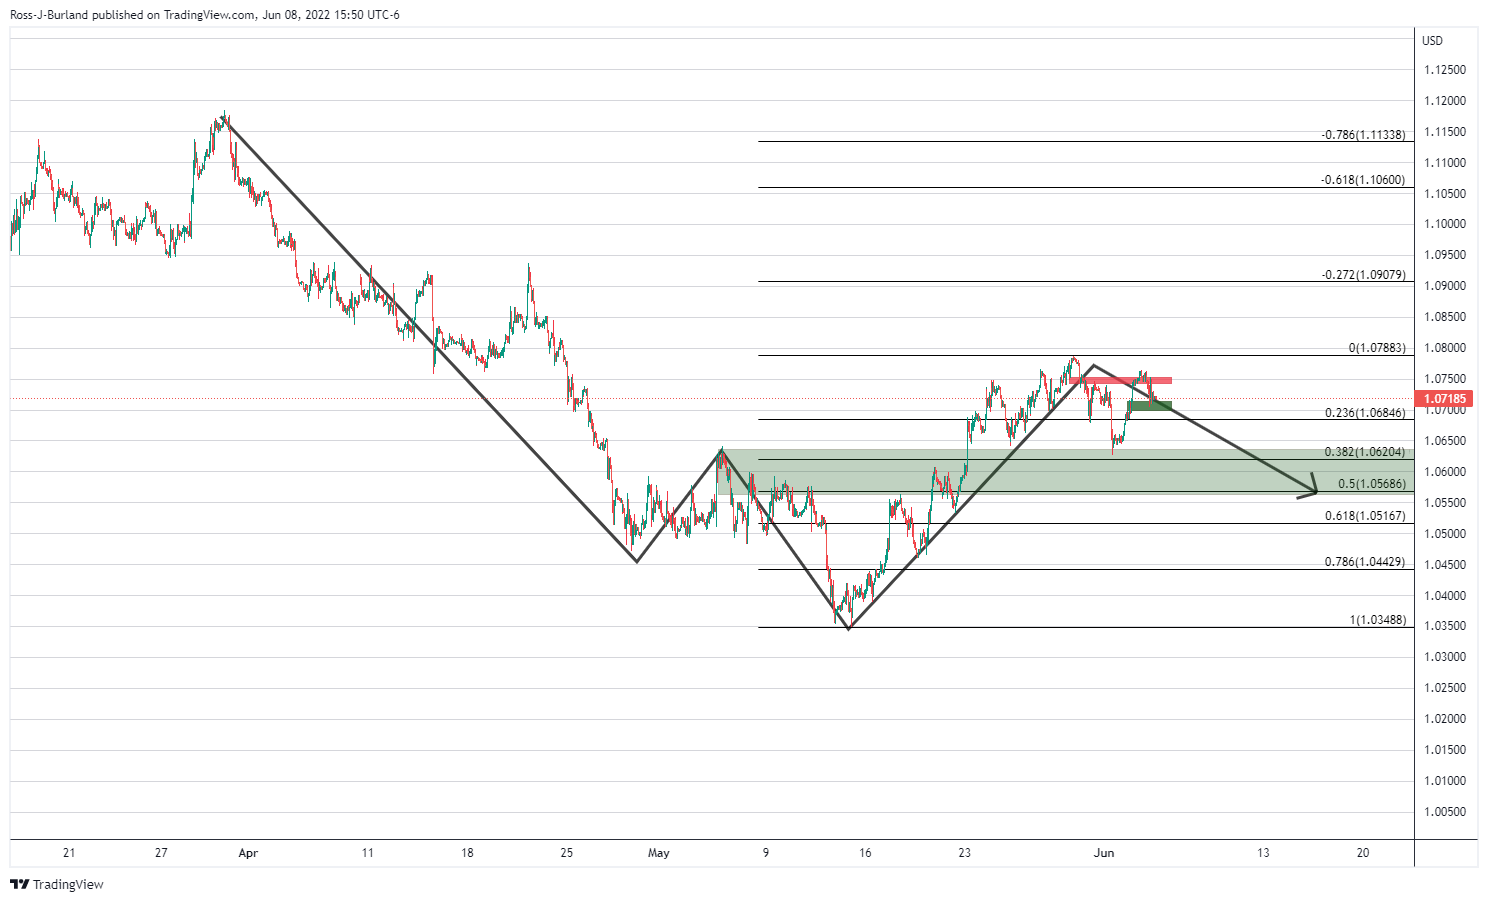
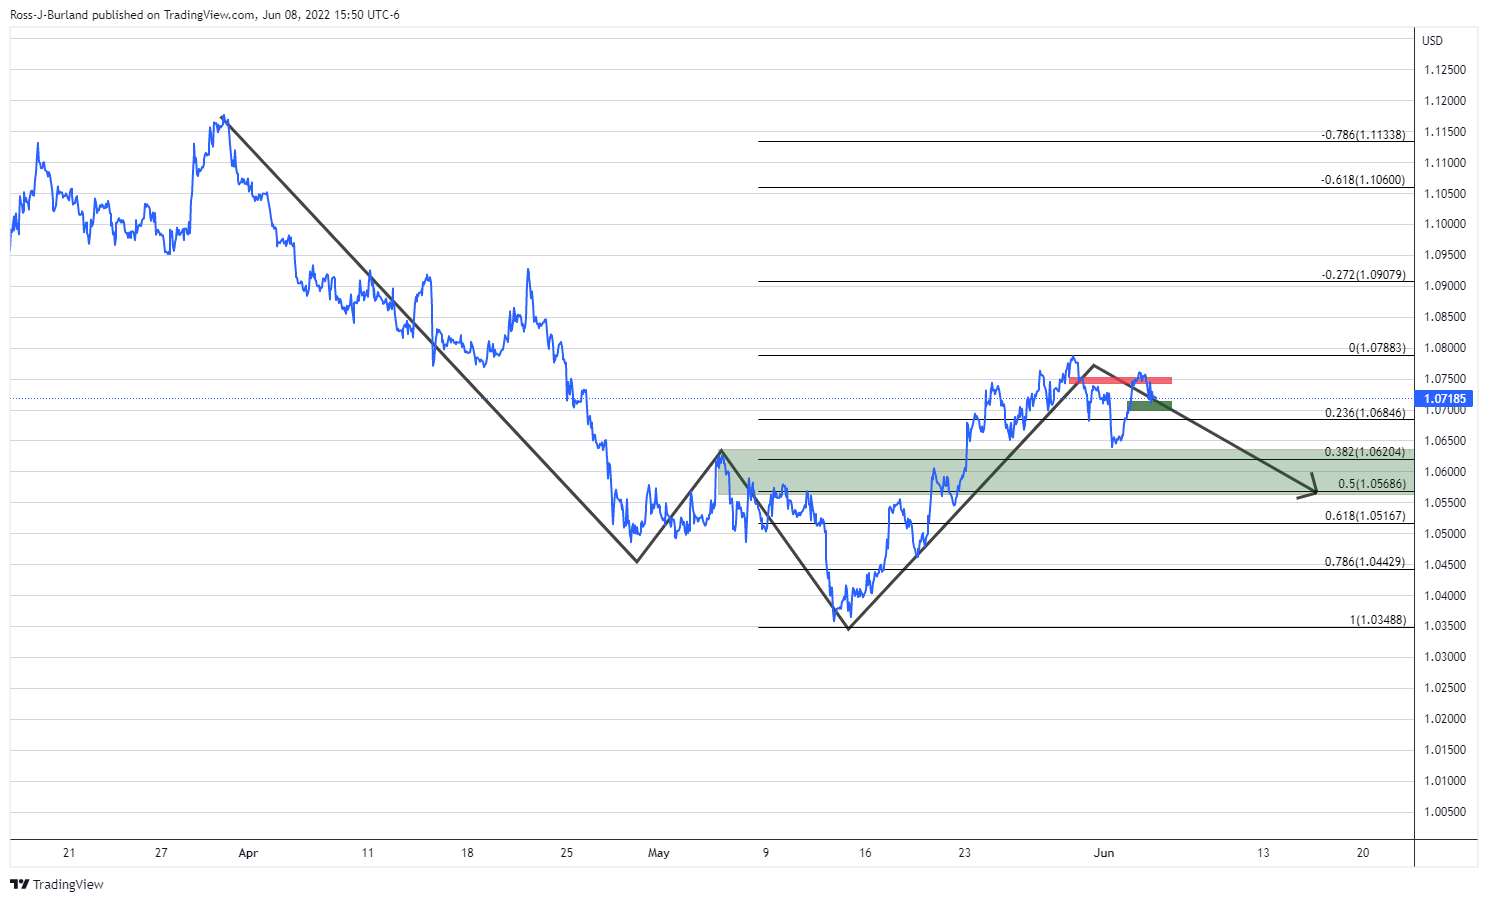
A line chart shows the weekly W pattern more clearly:
H4 charts
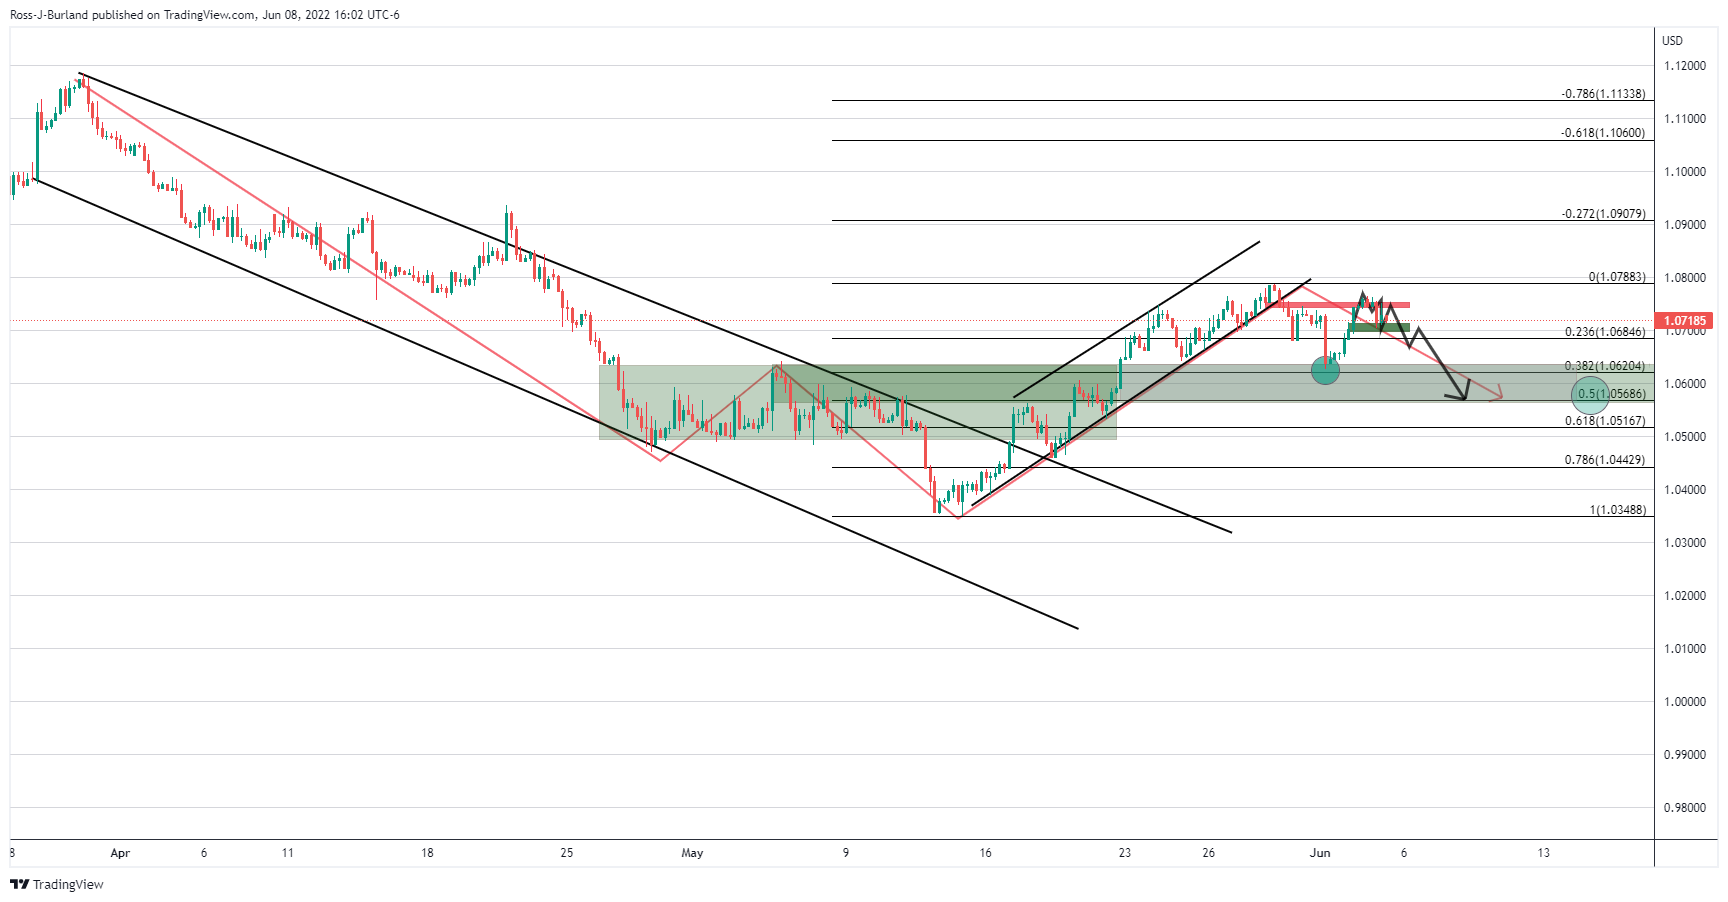
Where there is less noise on the four-hour chart, zooming in on the near-term price action and structure, we can see an M-formation has developed. There are prospects of either some sideways consolidation between resistance and support before a breakout to the downside if we do not get that beforehand.