- EUR/USD Price Analysis: Retreats towards 1.0700 inside bull flag, RSI divergence, ECB in focus
Market news
EUR/USD Price Analysis: Retreats towards 1.0700 inside bull flag, RSI divergence, ECB in focus
- EUR/USD snaps two-day rebound, holds lower ground near intraday bottom.
- Bullish chart formation joins upbeat RSI signals, sustained trading beyond 200-SMA to keep buyers hopeful.
- Weekly support line acts as an intermediate halt ahead of the key 1.0600 level.
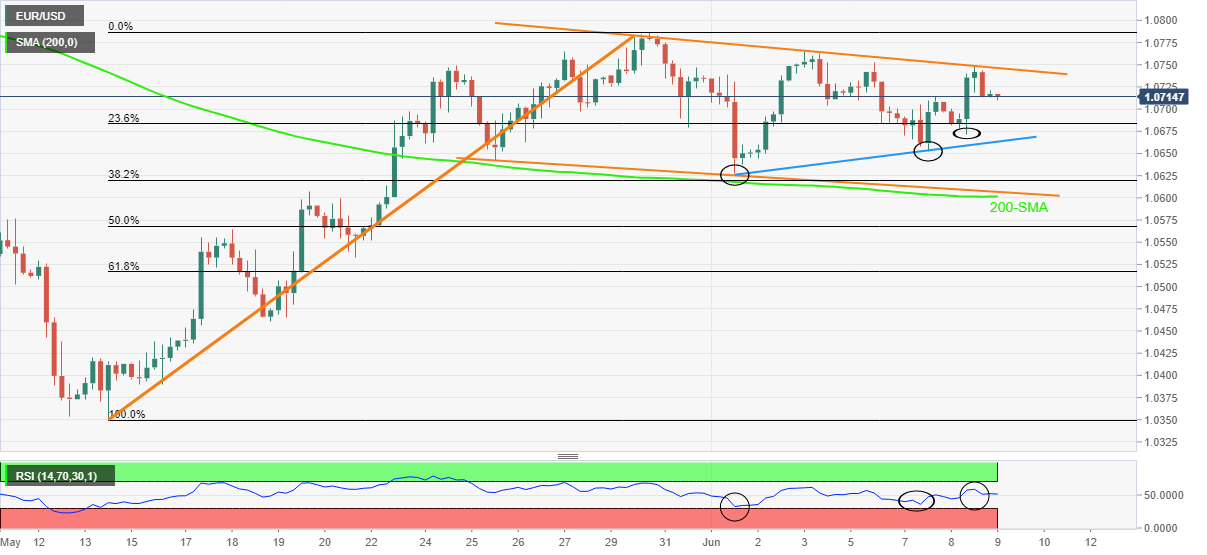
EUR/USD consolidates recent gains around 1.0710 during the inactive Asian session on Thursday. In doing so, the major currency pair portrays the pre-ECB anxiety inside a bullish chart pattern called flag.
In addition to the bull flag, the sync of the higher lows in prices with those of the RSI (14), known as bullish divergence, as well as the pair’s sustained trading beyond the 200-SMA, also keeps EUR/USD buyers hopeful.
That said, the quote’s latest pullback eyes a weekly support line near 1.0665 but a confluence of the 200-SMA and the flag’s lower line, near 1.0600 appears a tough nut to crack for the bears.
Should EUR/USD drop below 1.0600, May 18 high surrounding 1.0565 could act as the last defense for the buyers.
Alternatively, an upside clearance of the flag’s upper line, at 1.0750 by the press time, will confirm the bullish chart pattern and suggest (theoretically) an upside move towards 1.1100.
However, tops marked during May and late April, respectively near 1.0785 and 1.0940, could act as the extra upside filters.
EUR/USD: Four-hour chart
Trend: Further recovery expected