- USD/JPY Price Analysis: Negative divergence sent the pair tumbling before reclaiming 132.00
Market news
USD/JPY Price Analysis: Negative divergence sent the pair tumbling before reclaiming 132.00
- Negative divergence on the USD/JPY daily chart caused a drop of 200-pips, right above May 9 high at around 131.34.
- A risk-off market mood favors the Japanese yen, despite the Fed rate hike.
- A USD/JPY move above 133.00 opens the door towards 135.00, otherwise, a fall towards 131.00 is on the cards.
The USD/JPY extends its losses for the second consecutive day, despite a larger than initially expected 75 bps rate hike by the Federal Reserve, which initially boosted the greenback, with the USD/JPY jumping near 135.00, but gave way for JPY bulls, which since then, dragged the pair down below the 132.00 area. At the time of writing, the USD/JPY is trading at 132.06.
US equities remain on the backfoot as recession fears mount. In the meantime, the greenback remains on the defensive, as illustrated by the US Dollar Index (DXY), down 1.1%, at 103.698. US Treasury yields, led by the 10-year benchmark note, is down six basis points, yielding 3.330%.
Also read: USD/JPY Price Analysis: Hovers around 133.80s as a negative divergence emerges
USD/JPY Price Forecast: Technical outlook
Daily chart
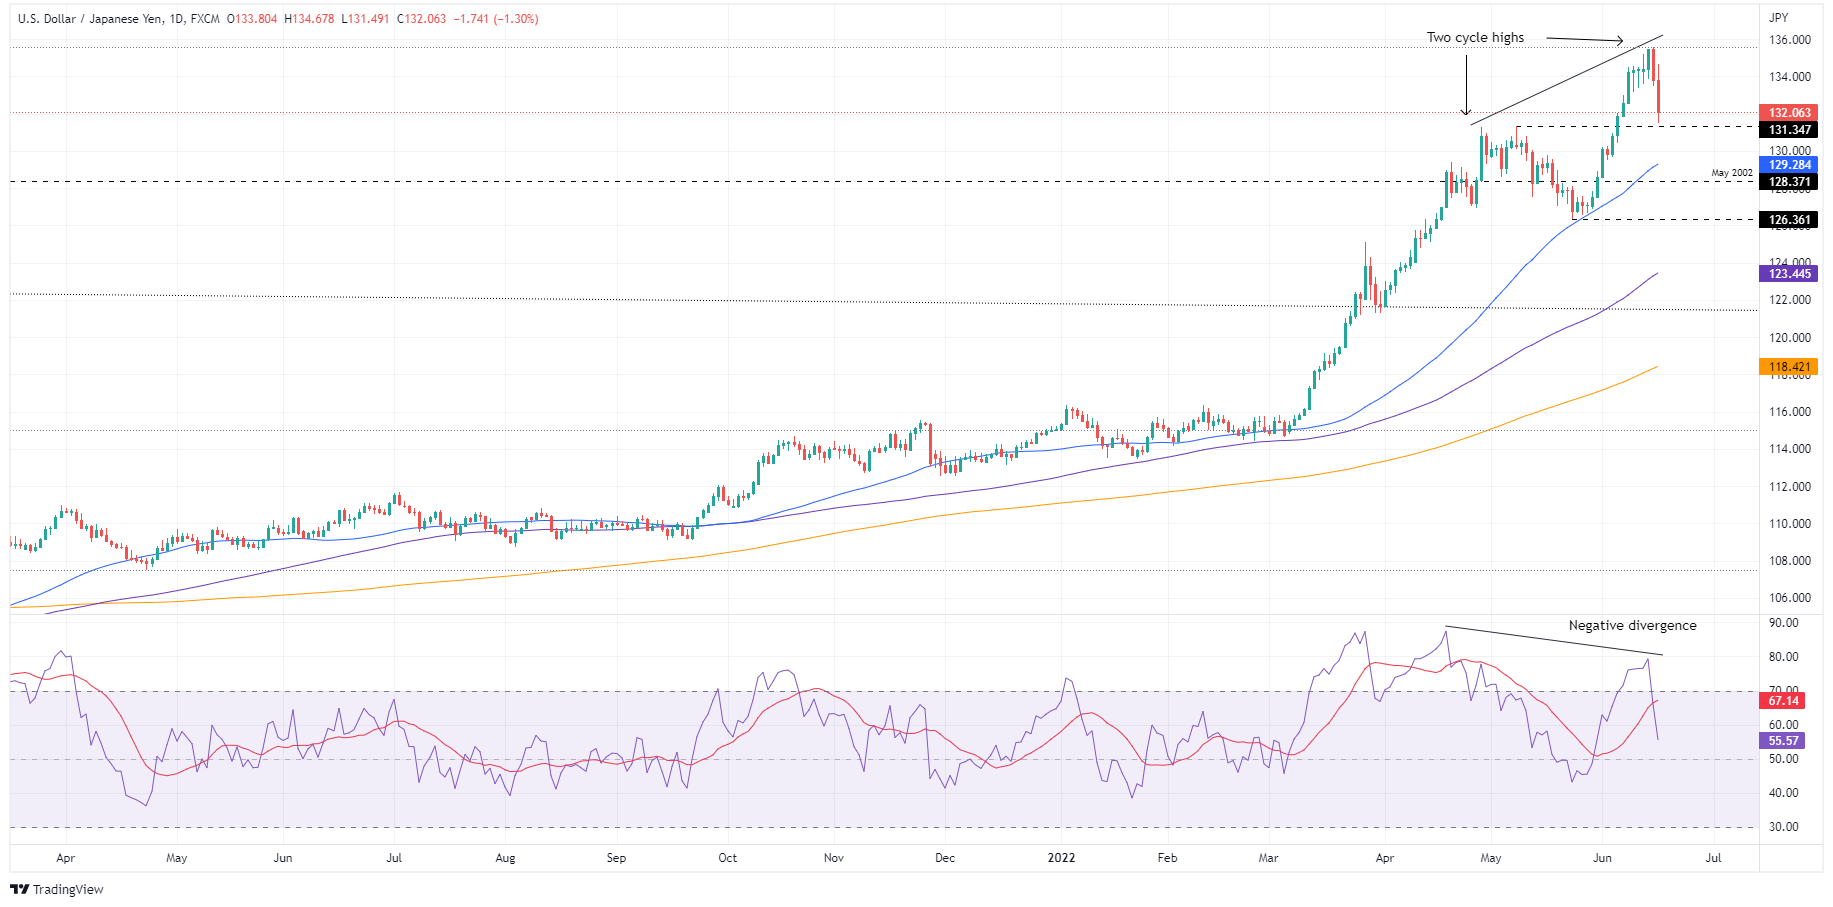
In an article on June 15, a technical analysis piece on the USD/JPY, I wrote that “the last couple of cycle highs were recorded as the Relative Strenght Index (RSI) registered two peaks, but the second peak was lower than the previous one, meaning a negative divergence formed. That said, the USD/JPY might be headed for a pullback.”
That said, during Thursday’s trading session, the USD/JPY tanked 200 pips from the daily high at 134.67 towards the daily low at around 131.49, 15 pips above the May 9 daily high-turned-support at 131.34.
4-hour chart
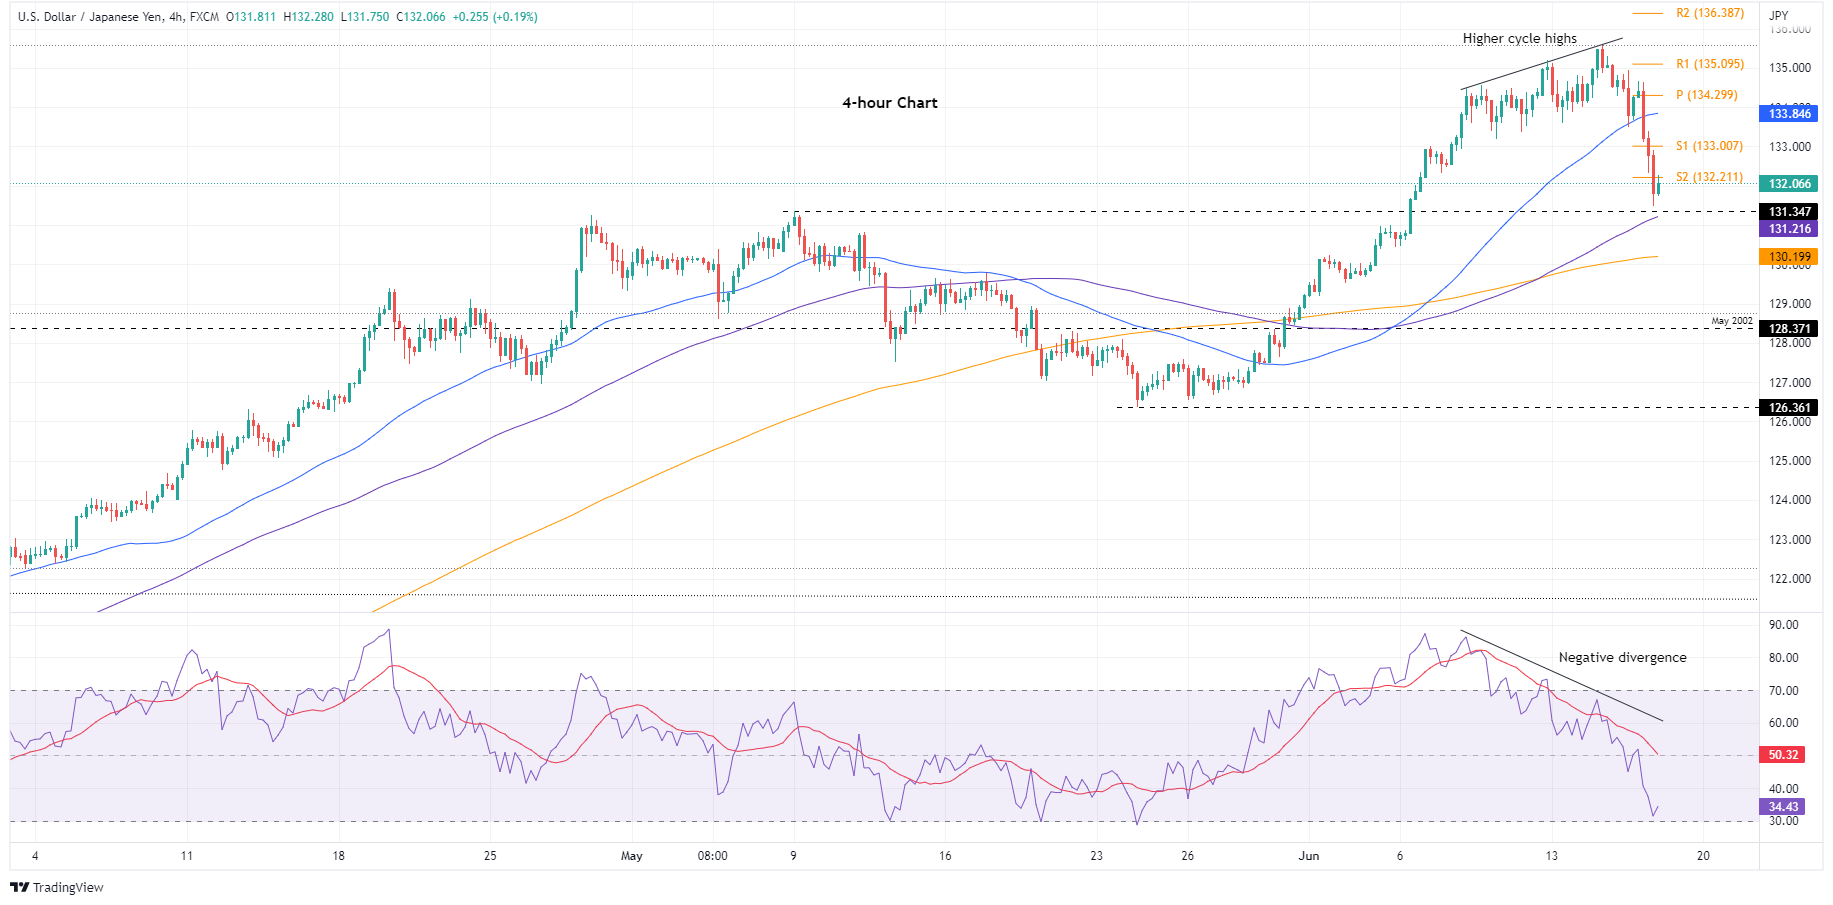
The USD/JPY is neutral-upward biased, as illustrated by the 4-hour chart. Once the negative divergence tumbled the pair towards 131.40s, buying pressure lifted the pair back above the 132.00 mark. Nevertheless, a move of the Relative Strength Index (RSI) above the 50-midline, alongside a USD/JPY rally towards 133.00, is needed if USD/JPY bulls would like to remain in control.
Upwards, the USD/JPY’s first resistance would be the S2 daily pivot at 132.21. Break above would expose the S1 pivot point at 133.00, followed by the 50-simple moving average (SMA) at 133.84. On the flip side, the USD/JPY first support would be 132.00. A breach of the latter would send the pair towards the May 9 high at 131.34, followed by the 100-SMA at 131.21 and then the 200-SMA at 130.19
Key Technical Levels