- WTI Price Analysis: Bulls approach $115.00 inside fortnight-old descending triangle
Market news
WTI Price Analysis: Bulls approach $115.00 inside fortnight-old descending triangle
- WTI extends recovery from weekly low as triangle’s support, 200-SMA defend bulls.
- MACD, RSI adds strength to the upside bias but bulls need validation from $118.00.
- Bears have a bumpy road to travel before retaking control.
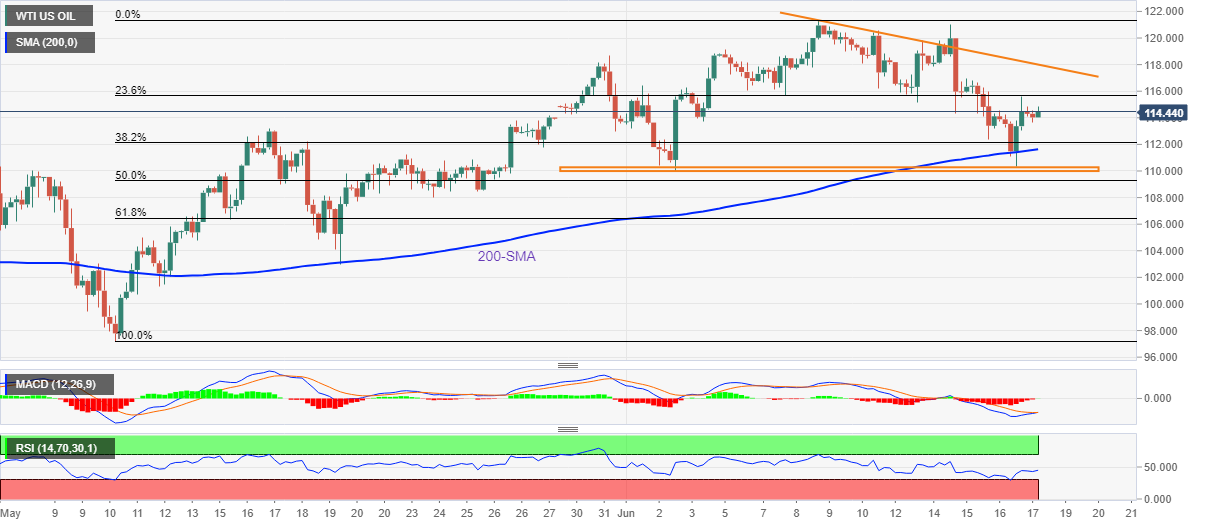
WTI remains on the front foot heading into Friday’s European session, after bouncing off a two-week low the previous day. That said, the black gold picks up bids around $114.64, up 0.13% by the press time.
The oil benchmark refreshed its weekly low the previous day before recovering from the 200-SMA. In doing so, the commodity prices also rebounded from the early June levels.
Thursday’s U-turn could be joined with the quote’s gradual easing since June 08 to portray a short-term descending triangle bullish chart pattern.
In addition to the chart pattern and the recovery from 200-SMA, steady RSI and impending bull-cross on the MACD also keep buyers hopeful.
It’s worth noting, however, that the WTI needs to cross the triangle’s upper line, around $118.00 by the press time, to convince the bulls to challenge the monthly top near $121.35.
Failing to do so can again drag it back to the 200-SMA level of $111.65.
Should the quote drops below $111.65, the lower-end of the stated triangle, near $110.00, could lure the WTI sellers.
Following that, 61.8% Fibonacci retracement (Fibo.) of the May-June downturn and mid-May swing low, respectively around $106.50 and $103.00 may entertain the energy benchmark ahead of highlighting the $100.00 psychological magnet.
WTI: Four-hour chart
Trend: Further upside expected