- US Dollar Index Price Analysis: Bulls approach 104.75 resistance confluence
Market news
US Dollar Index Price Analysis: Bulls approach 104.75 resistance confluence
- US Dollar Index bounces off weekly low to snap two-day downtrend.
- Two-day-old descending trend line, 23.6% Fibonacci retracement guards immediate upside.
- 100-EMA restricts short-term declines ahead of monthly support line.
- Steady RSI, sustained bounce off key EMA favor buyers.
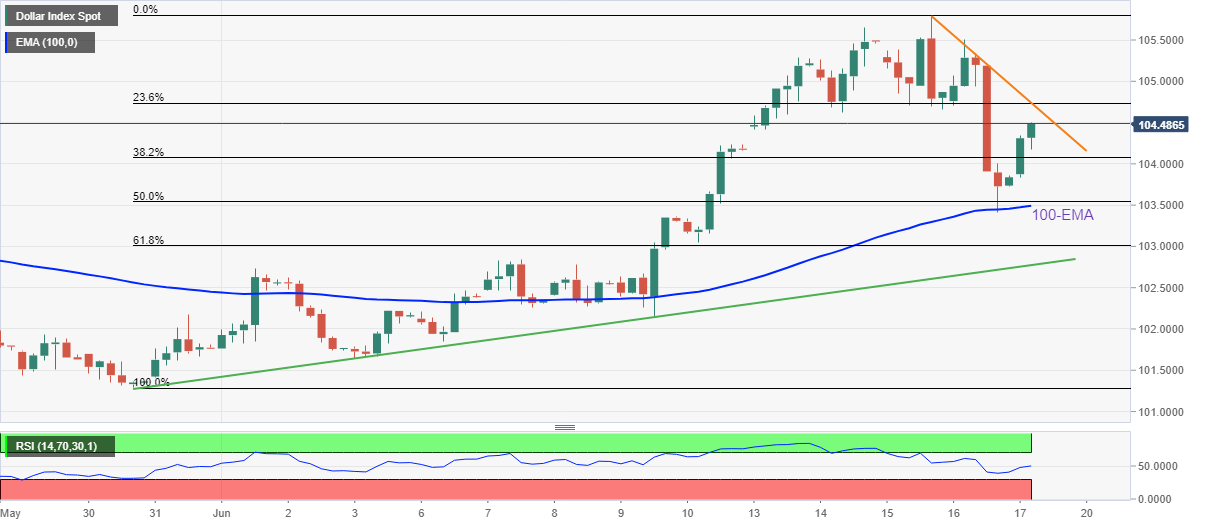
US Dollar Index (DXY) takes the bids to refresh its intraday high around 104.50 heading into Friday’s European session.
The greenback’s gauge versus the six major currencies refreshed the weekly low before bouncing off the 100-EMA level the previous day. That said, steady RSI (14) also backs the DXY recovery and hints at the quote’s sustained run-up moving forward.
However, a convergence of the descending trend line from Wednesday joins the 23.6% Fibonacci retracement level of May 30 to mid-June’s advances, around 104.75, appears a tough nut to crack for the DXY bulls.
Should the greenback buyers manage to cross the 104.75 hurdle, the odds of witnessing a fresh multi-month high, currently around 105.80, can’t be ruled out.
On the contrary, pullback moves could retest the 100-EMA level of 103.50, with the 38.2% Fibonacci retracement near 104.10 acting as immediate support.
Even if the quote drops below 103.50, the 61.8% golden ratio of Fibonacci and an upward sloping support line from late May, respectively near 103.00 and 102.75, will be crucial to invite the bears.
DXY: Four-hour chart
Trend: Further upside expected