- S&P 500 rises and reclaims the 3700 threshold after a holiday in the US
Market news
S&P 500 rises and reclaims the 3700 threshold after a holiday in the US
- US stocks jumped following a US bank holiday, up between 1.78% and 3.07%.
- The Nasdaq Composite leads the pack, followed by the S&P 500 and the Dow Jones.
- US Treasury yields edge up while the US Dollar Index drops.
US stocks are opening with hefty gains, following a dismal week, which dragged the SP 500 officially to a bear market after plunging more than 20% from all-time-highs, but as North American traders returned from a long weekend, US equities depict an upbeat market mood.
The S&P 500 is gaining some 2.51%, trading at 3,766.49, while the tech-heavy Nasdaq Composite (NDQ) is back above the 11,000 threshold, rallying 3.07%, at 11,130.10. The laggard in the session, but jumping more than 500 points, is the Dow Jones Industrial Average (DJIA), up 1.78%, advancing to 30,419.48.
In the meantime, the US Dollar Index extends its losses in the week and sits around 104.290, down by 0.11%. US Treasury yields remain elevated, and the US 10-year note yields 3.288%, up by two basis points.
Fundamentally nothing has changed, and some financial analysts perceive the rally as a “death cat bounce.” Last Wednesday, the US Federal Reserve hiked 75 bps rates, the biggest move since 1994, and Fed’s Chief Powell said that although those moves would not be “common,” he stated that in July, another 75 bps might be on the table.
Sector-wise, the leading gainers are Energy, up 4.85%, followed by Consumer Discretionary and Technology, each recording gains of 3.42% and 2.91%, respectively. The laggards but also positive in the day are Utilities, Consumer Staples, and Materials, up by 1.27%, 1.40%, and 1.60% each.
In the commodities complex, the US crude oil benchmark, WTI, grinds higher by 2.69%, trading at $110.88 BPD. At the same time, precious metals like gold (XAU/USD) followed suit, edging higher 0.29%, exchanging hands at $1845.65 a troy ounce.
SP 500 Chart
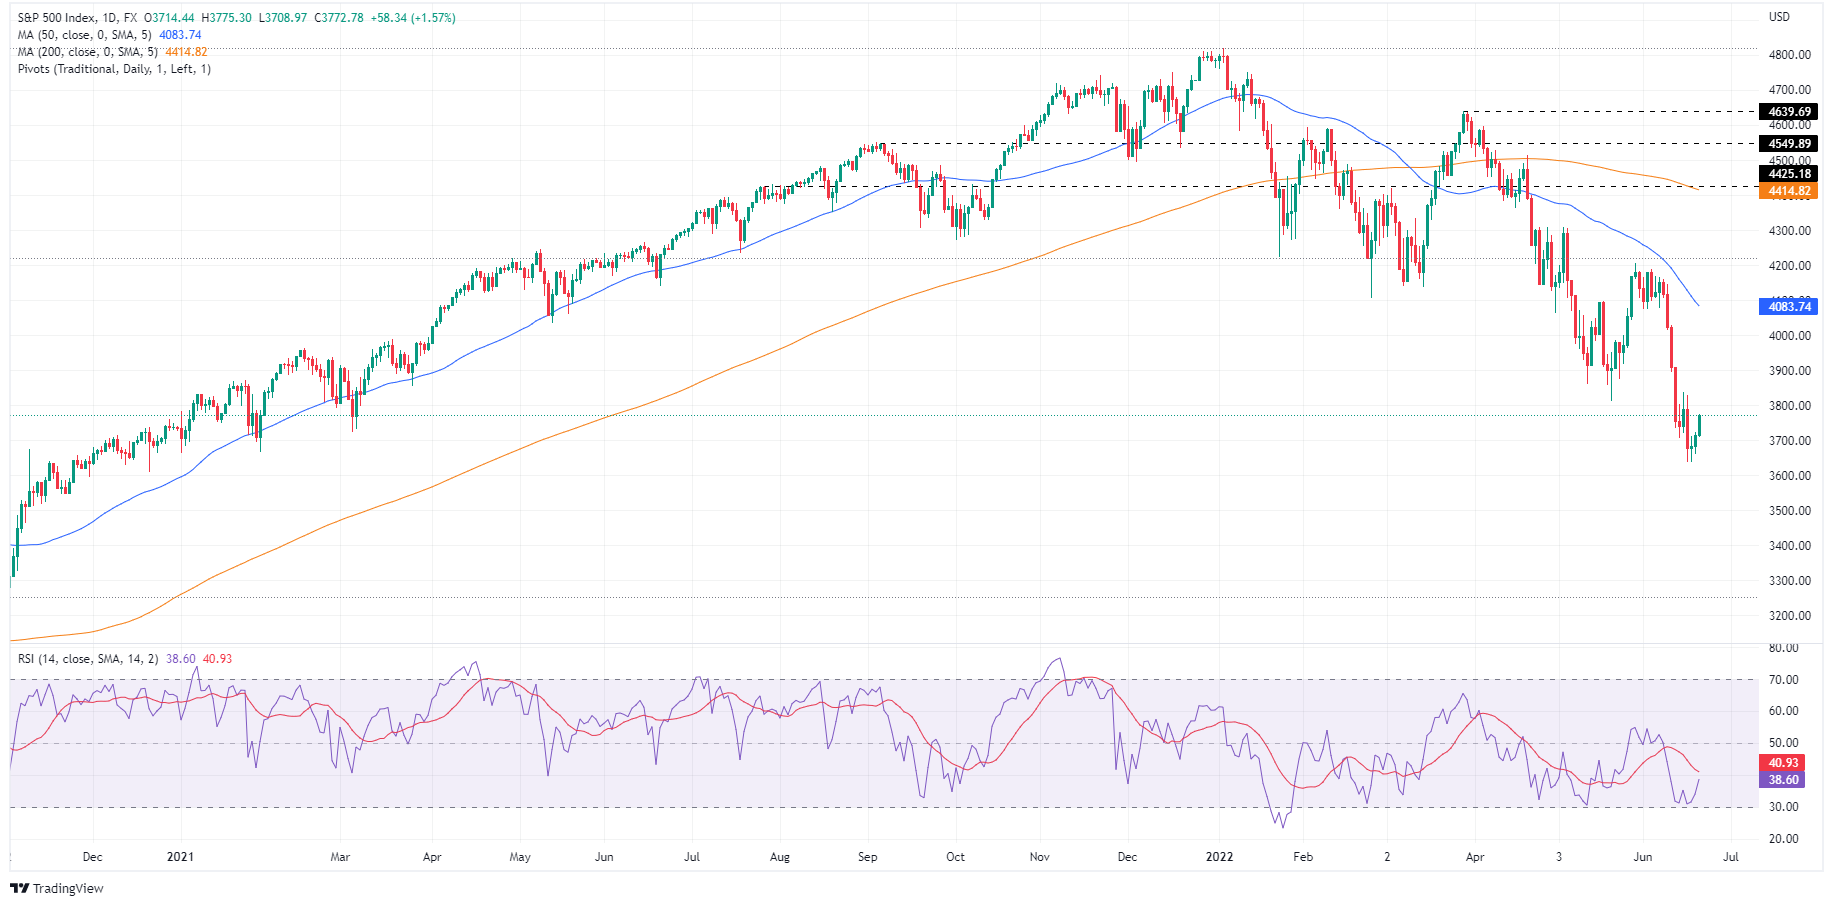
Key Technical Levels