- AUD/JPY Price Analysis: Buyers’ failure at 97.00 would send the pair tumbling towards 90.00
Market news
AUD/JPY Price Analysis: Buyers’ failure at 97.00 would send the pair tumbling towards 90.00
- The AUD/JPY remains boosted by a risk-on mood, though sentiment remains fragile.
- AUD/JPY Price Forecast: Negative divergence emerging in the month/weekly chart loom and might open the door for further losses.
The Australian dollar rallied 130 pips vs. the Japanese yen on Tuesday due to the stubbornness of the Bank of Japan (BoJ), which pledged to its ultra-loose monetary policy and is the only central bank in the G8 that showed no intentions of tightening policy in the near term. At 95.06, the AUD/JPY is barely up by 0.01% as the Asian session begins, though, in the last couple of days, it has been gaining 1.50%.
Asian futures are trading in the green, setting cash equity markets for a higher open. Nevertheless, sentiment remains fragile. Although China’s Covid-19 news shows that authorities remain in control, additional lockdowns could shift investors’ mood and drag the AUD/JPY down.
AUD/JPY Price Forecast: Technical outlook
Monthly chart
The AUD/JPY monthly chart shows that the exchange rate approached near the May 2015 highs but retreated 50 pips shy and printed a six-year-highs. Failure at the aforementioned kept the AUD/JPY consolidating and opened the door for a reversal towards the September 2017 highs around 90.30.

Weekly chart
The AUD/JPY weekly chart illustrates the pair as upward biased on pure market structure. Nevertheless, a negative divergence between AUD/JPY’s price action and the Relative Strength Index (RSI) suggests that the cross might be headed downwards. Traders should be aware that, albeit a negative divergence shows, the current price action opens the door for a re-test of May 2015 highs around 97.30.

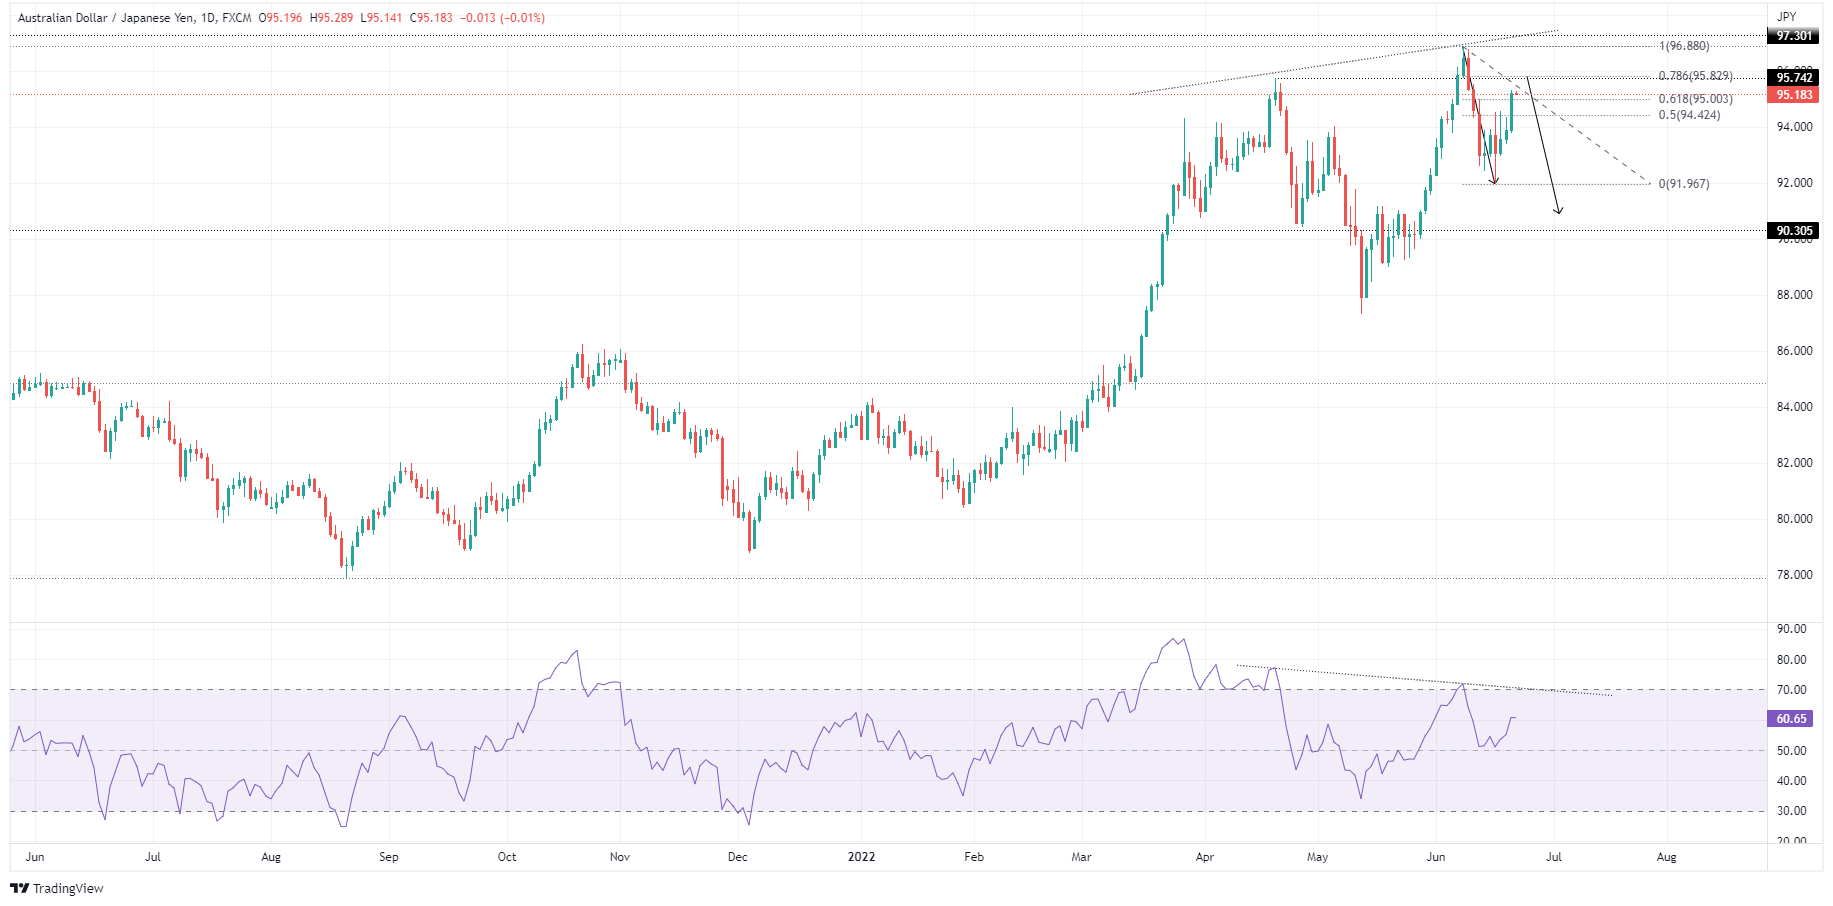
Daily chart
The AUD/JPY daily chart is still upward biased, though the last two higher highs, being April 20 at 95.74 and June 8 at 96.88, were reached on RSI’s lower highs, meaning that buyers are not committing to lift the AUD/JPY to higher prices, opening the door for a shift in the trend.
Digging a little deep, if the AUD/JPY exchange rate breaks above April’s 20 swing high at 95.74, that would open the door for a test of May’s 2015 high at 97.30. Otherwise, failure to break above the 78.6% Fibonacci retracement alongside RSI’s acceleration downwards might open the door for a fall towards the September 2017 high-turned-support at 90.30.