- USD/CHF Price Analysis: 50% Fibo. tests rebound from 100-day EMA below 0.9600
Market news
USD/CHF Price Analysis: 50% Fibo. tests rebound from 100-day EMA below 0.9600
- USD/CHF grinds higher after taking a U-turn from the key EMA, horizontal support.
- 50% Fibonacci retracement of January-May upside guards recovery moves.
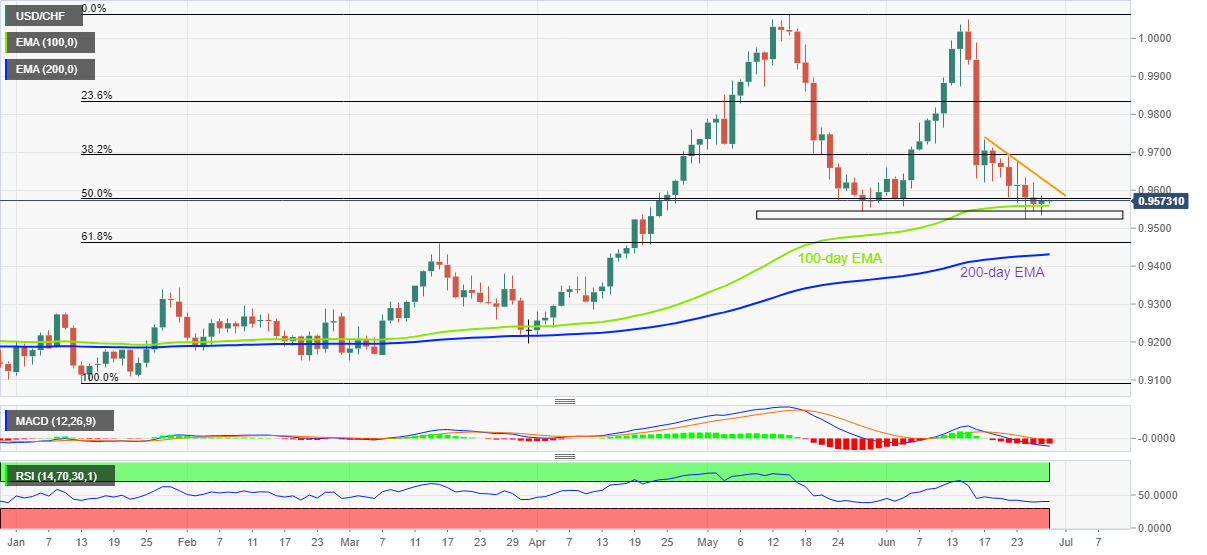
- Descending RSI line, bearish MACD signals challenge buyers, eight-day-old resistance line adds to the upside filters.
USD/CHF holds onto the previous day’s bounce off the 100-day EMA around 0.9575 during Wednesday’s initial Asian session. In doing so, the Swiss currency (CHF) pair jostles with the 50% Fibonacci retracement (Fibo.) of its January-May upside.
Although monthly horizontal support near 0.9520-45 adds strength to the downside filters, descending RSI (14) line, not oversold, joins the bearish MACD signals to hint at the USD/CHF pair buyer's hardships.
That said, a weekly resistance line near 0.9620 also challenges the short-term USD/CHF recovery, apart from the 50% Fibo. level of 0.9578.
Even if the quote rises past 0.9620, the 0.9700 round figure and multiple hurdles surrounding 0.9715 may test the bulls before giving them control.
On the contrary, a downside break of the 0.9520 support could direct the USD/CHF sellers towards the 61.8% Fibonacci retracement level near 0.9465.
Following that, the 200-day EMA level of 0.9430 will challenge the pair’s further downside, a break of which won’t hesitate to direct the quote towards January’s high near 0.9345.
USD/CHF: Daily chart
Trend: Limited upside expected