- WTI Price Analysis: Weekly ascending trend channel defends buyers above $108.00
Market news
WTI Price Analysis: Weekly ascending trend channel defends buyers above $108.00
- WTI pares the biggest daily losses in a week inside a bullish chart pattern.
- Pullback from 200-SMA, bearish MACD signals challenge buyers.
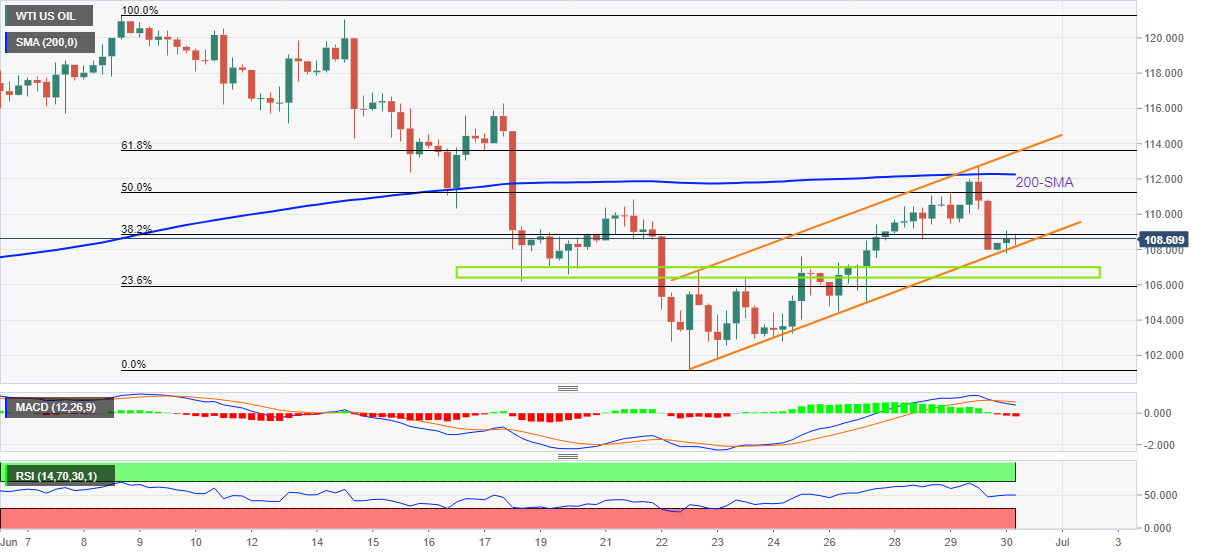
- Bears need validation from $106.40, RSI hints at gradual recovery.
WTI crude oil prices consolidate the week’s biggest daily loss while picking up bids to $108.70 heading into Thursday’s European session.
The black gold dropped the most in over a week the previous day while stepping back from the 200-SMA. However, the support line of a one-week-old bullish trend channel triggered recovery moves earlier in the day.
That said, the bearish MACD signals challenge the upside momentum, suggesting the need for an upside break of the 38.2% and 50% Fibonacci retracement levels of June 08-22 downside, respectively around $108.85 and $111.25, to recall the buyers.
Even so, the 200-SMA level of $112.25 will precede a convergence of the stated channel’s upper line and 61.8% Fibonacci retracement, near $113.60, to challenge the commodity’s further upside.
Meanwhile, pullback moves should break the channel’s support line, close to $108.00 by the press time, to tease WTI sellers.
Though, multiple levels marked since June 20, between $107.00 and $106.40, could challenge the quote’s further downside before highlighting the monthly low of $101.17 for oil bears.
Overall, WTI remains in the recovery mode but the upside momentum has multiple speed breakers.
WTI: Four-hour chart
Trend: Further upside expected