- WTI Price Analysis: Pauses on the way to $110.00 resistance confluence
Market news
WTI Price Analysis: Pauses on the way to $110.00 resistance confluence
- WTI grinds higher after rising for two consecutive days.
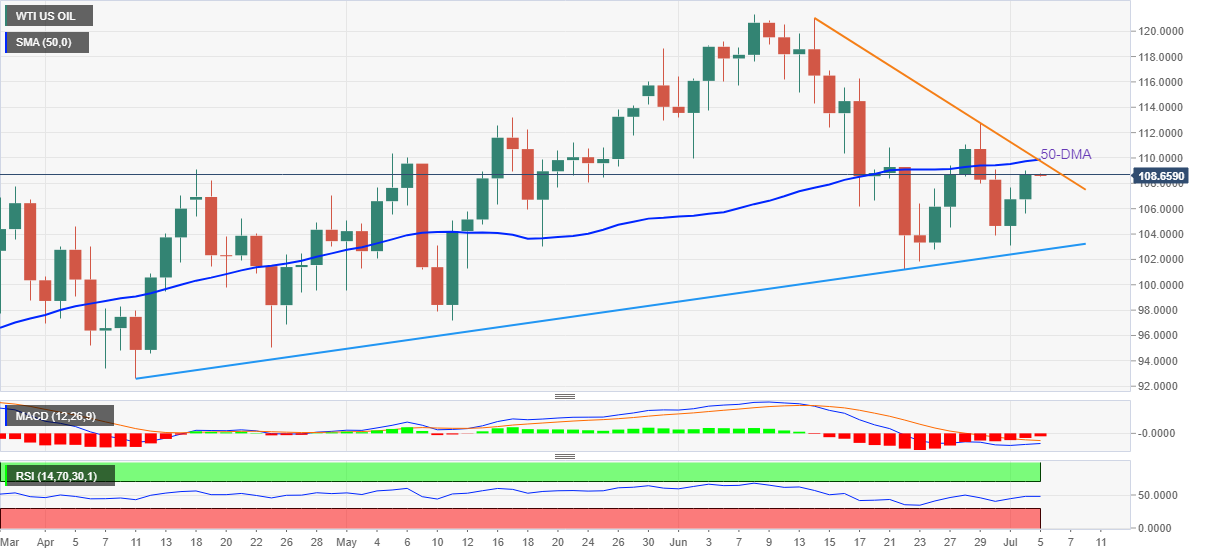
- 50-DMA, descending trend line from mid-June challenge buyers, three-month-old support line restricts the seller’s entry.
- Steady RSI, receding bearish bias of MACD hints at further recovery.
WTI bulls flirt with $109.00, around $108.65-70 by the press time of Tuesday’s Asian session, after rising for the last two days.
In doing so, the black gold not only snaps the two-day uptrend but also dribbles below the short-term key hurdle surrounding $110.00, comprising the 50-DMA and a three-week-old descending trend line.
However, recently improving MACD and RSI join the energy benchmark’s recovery moves from an upward sloping support line from early April to keep the buyers hopeful.
That said, a clear upside break of the $110.00 hurdle appears necessary for the bulls to keep reins.
Following that, a run-up towards June’s peak of $121.35 can’t be ruled out. Though, $113.20 and $120.00 levels may offer intermediate halts during the anticipated rally.
On the flip side, the aforementioned support line from April, near $102.70 at the latest, appears a tough nut to crack for the WTI bears.
Should the quote drop below $102.70, the odds of its fall towards June’s low of $101.17 can't be ruled out.
However, the commodity’s downside past $101.17 hinges on the bear’s ability to conquer the $100.00 threshold.
WTI: Daily chart
Trend: Further upside expected