- USD/CAD Price Analysis: Bears move in for the kill from key technical resistance
Market news
5 July 2022
USD/CAD Price Analysis: Bears move in for the kill from key technical resistance
- The 4-hour structure in USD/CAD has been broken at the start of this week.
- There is an emphasis on the downside for the sessions ahead.
CAD is benefitting from a risk-on environment and is sinking USD/CAD away from a key resistance area on the daily and 4-hour time frames. The following illustrates the bearish bias based on the daily chart's M-formation's neckline resistance and the break of structure on the 4-hour chart:
USD/CAD daily chart
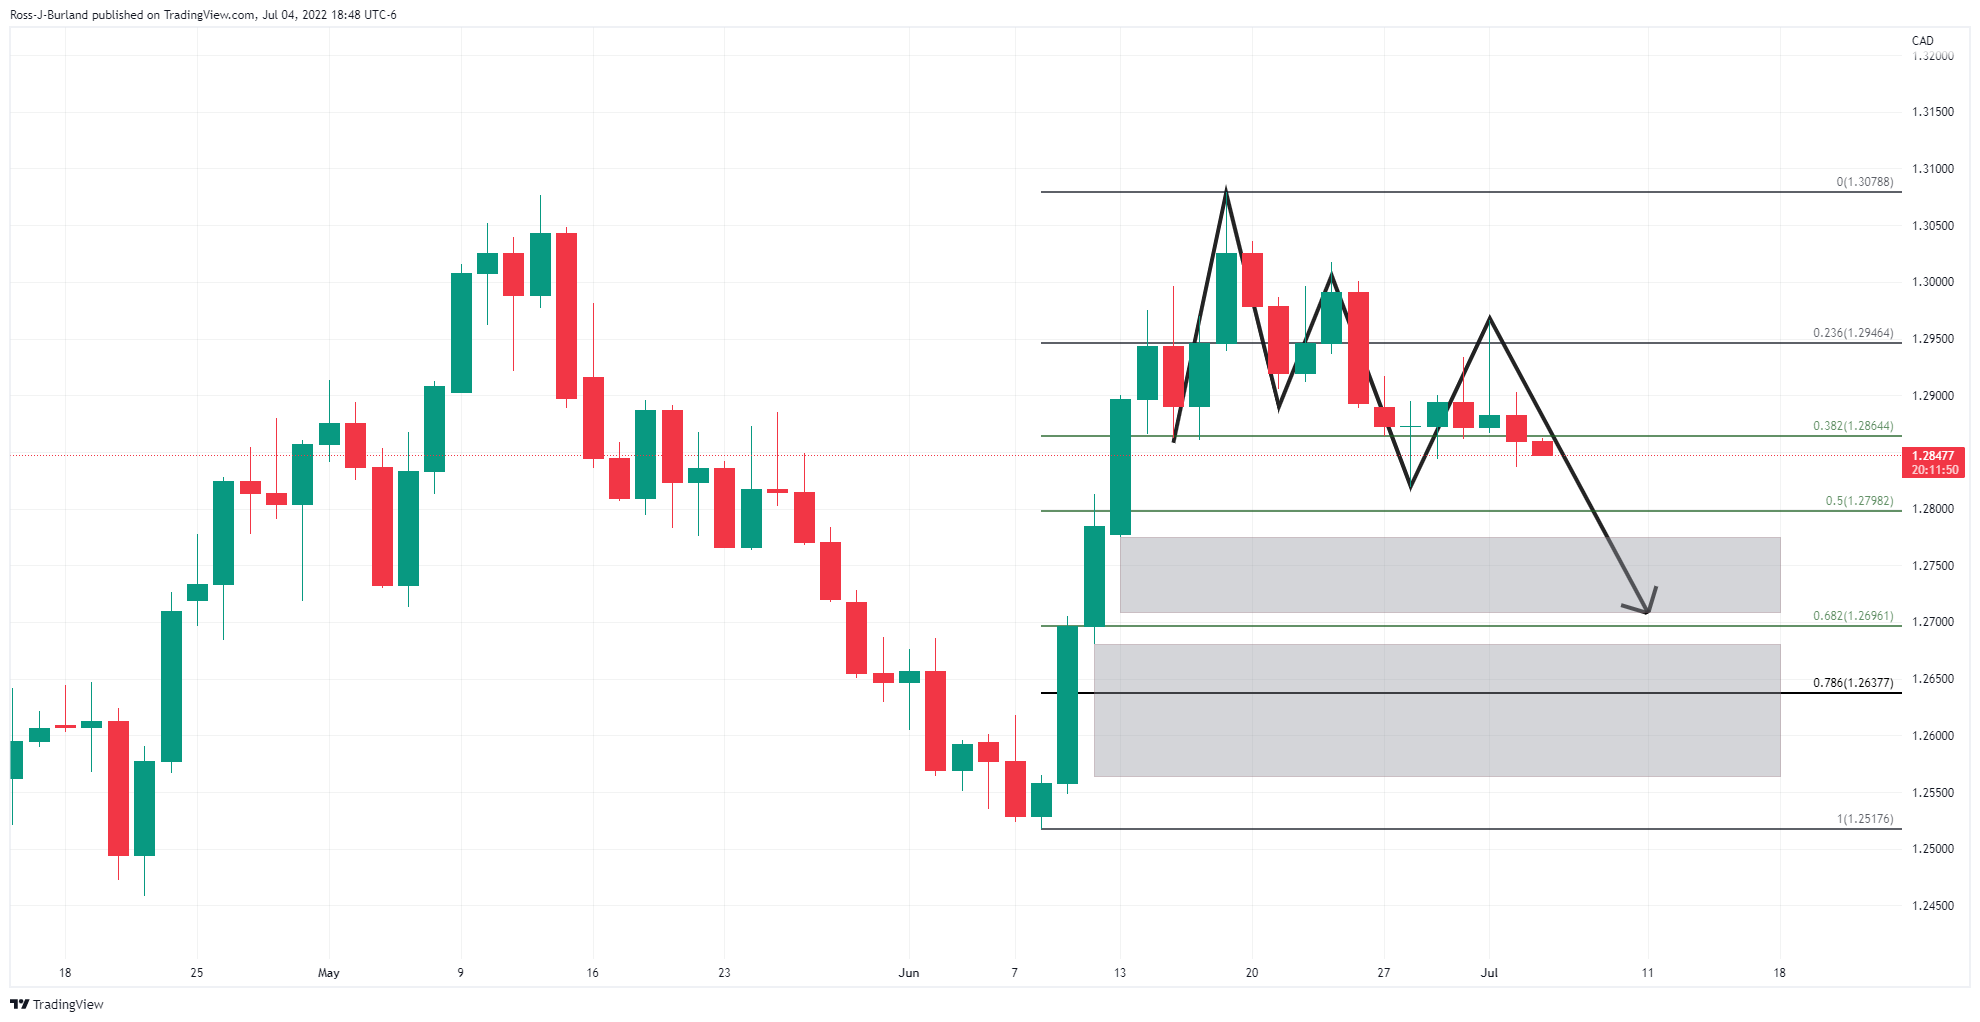
USD/CAD bears have moved in following a retest of the neckline and given the break of horizontal support and fresh lows made at the start of the week, there is a bias towards the price imbalances of the prior bullish impulse. The 50% mean reversion level has confluence in this regard and is a compelling target on the daily chart near 1.2800.
USD/CAD H4 chart
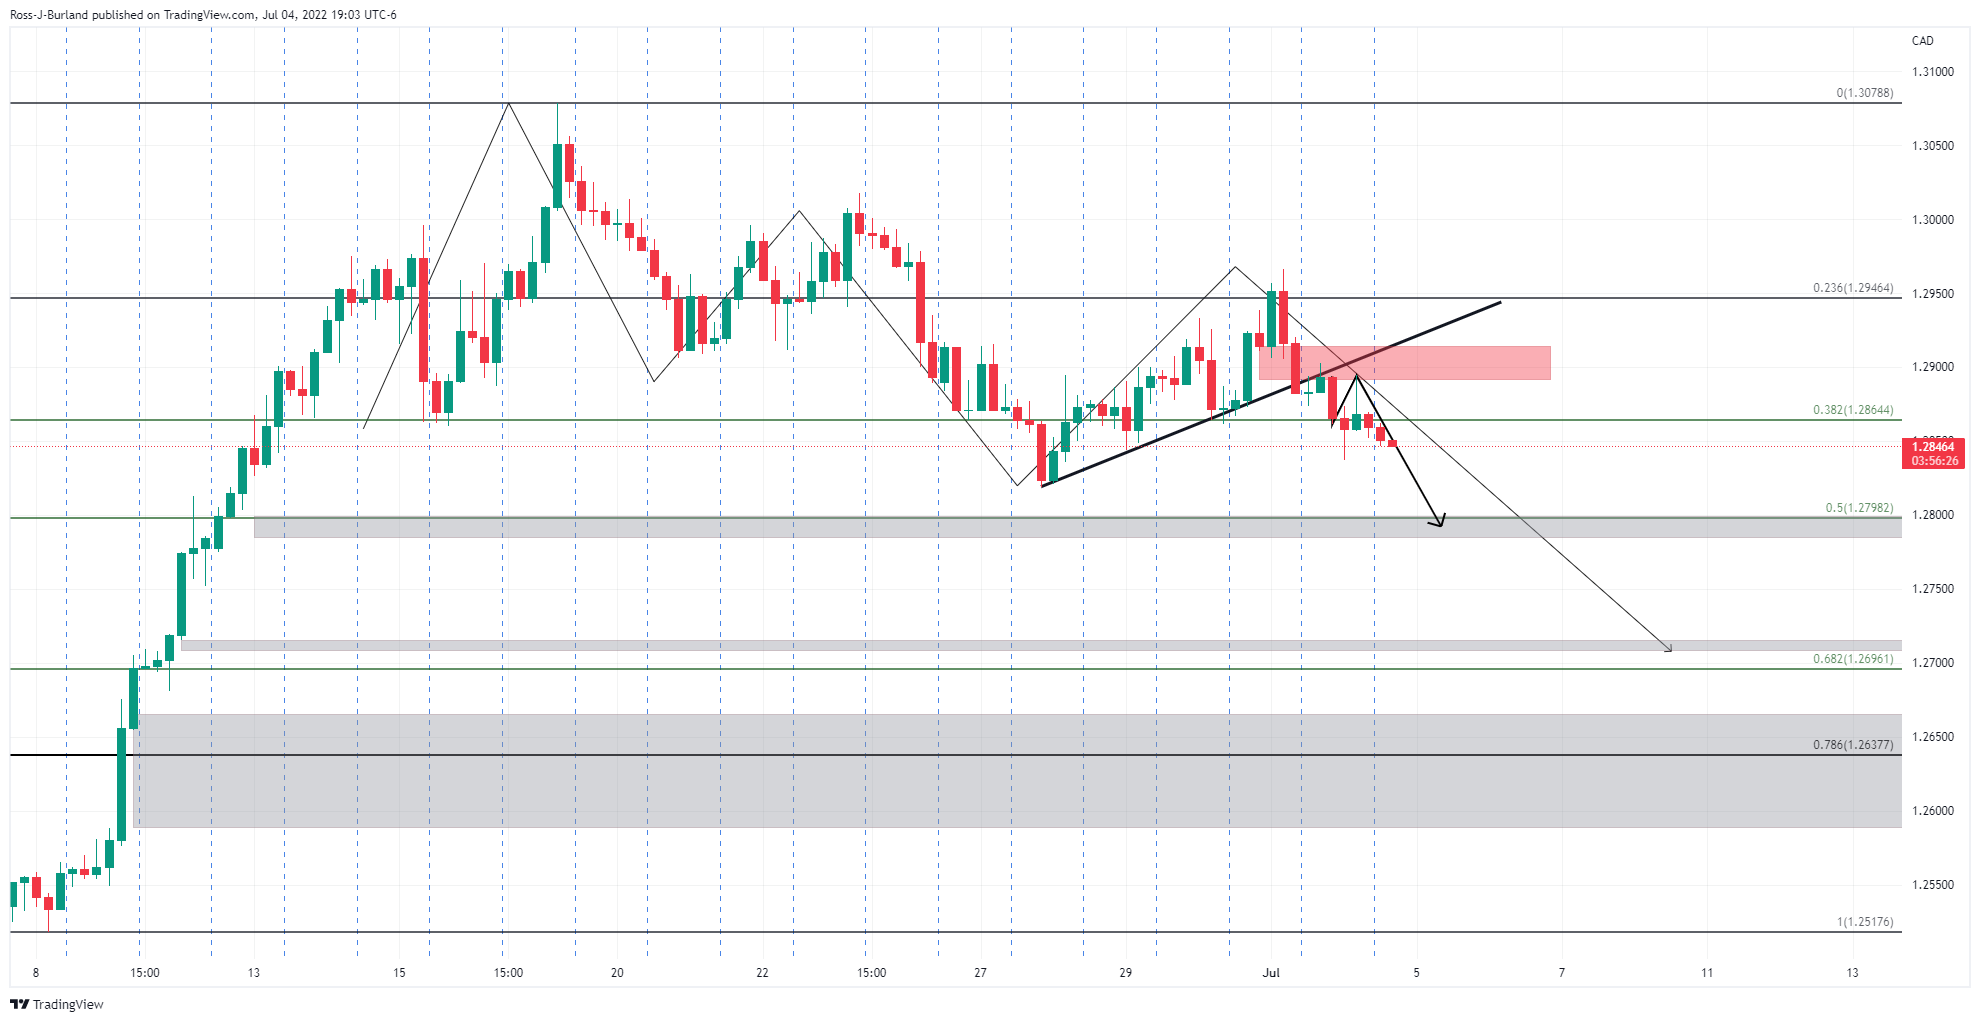
The 4-hour structure has been broken in the move lower this week which leaves the emphasis on the downside.
Market Focus
Open Demo Account & Personal Page