- USD/CHF Price Analysis: Climbs near 0.9800 on broad US dollar strength, risk aversion
Market news
USD/CHF Price Analysis: Climbs near 0.9800 on broad US dollar strength, risk aversion
- The USD/CHF is upward biased, but the change of posture of the Swiss National Bank (SNB) from dovish to hawkish could cap USD/CHF rallies toward the YTD high.
- USD/CHF Price Analysis: The daily and 1-hour charts illustrate an upward bias in the pair, so any pullbacks are better opportunities for buyers to step in.
The USD/CHF advances firmly on Monday amidst traders’ risk-off sentiment, which bolstered the greenback. However, last month’s Swiss National Bank (SNB) sudden shift towards a hawkish posture put a lid on the USD/CHF climb, retreating from daily highs around 0.9840.
The USD/CHF is trading around the 0.9790s region and remains positive in the day, up by 0.33% amidst a risk-aversion trading day.
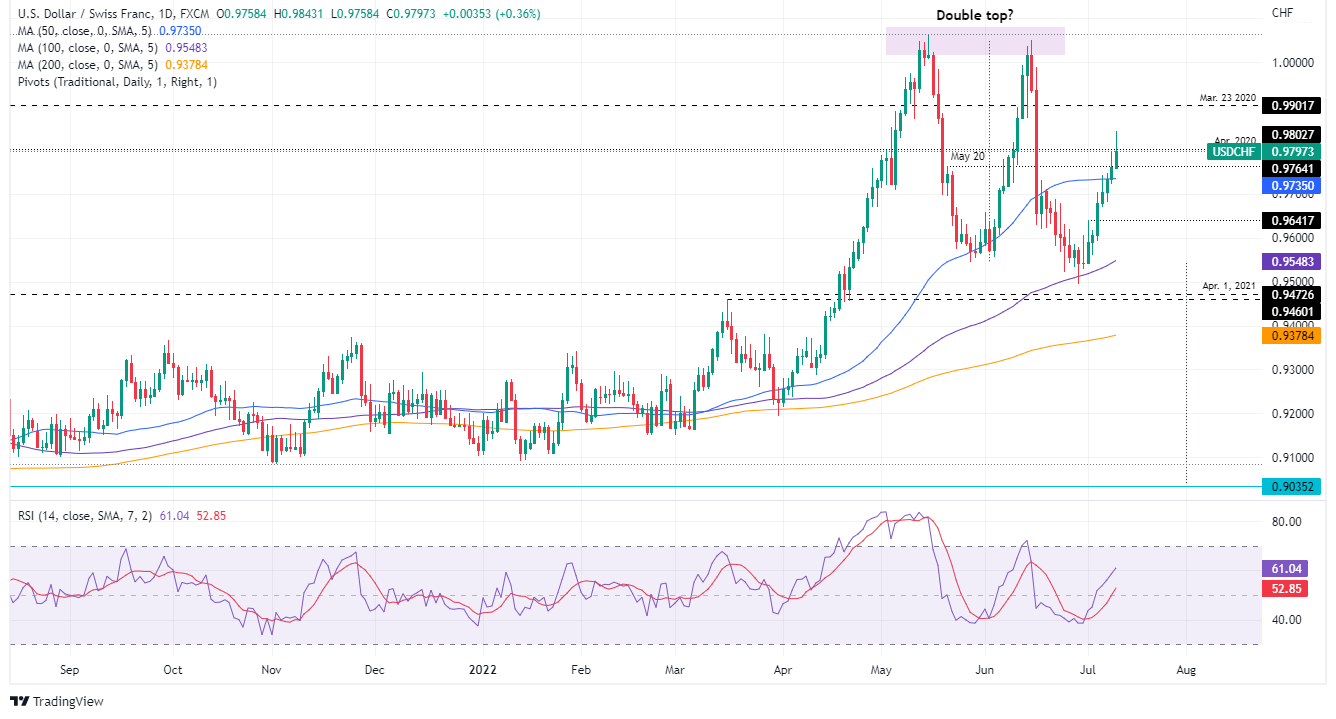
USD/CHF Daily chart
The USD/CHF is still in an uptrend, as depicted by the daily chart. However, some selling pressure emerged between the 0.9800-0.9900 range, dragging prices lower, below last Friday’s daily high at 0.9797. Oscillators remain in bullish territory, like the Relative Strength Index (RSI) at 60.67, with room to spare before reaching overbought conditions. Therefore, the USD/CHF path of least resistance will continue upwards.
That said, the USD/CHF first resistance will be 0.9800. A breach of the latter will send the major towards July 11 high at 0.9843, followed by May 23, 2020, daily high at 0.9901.
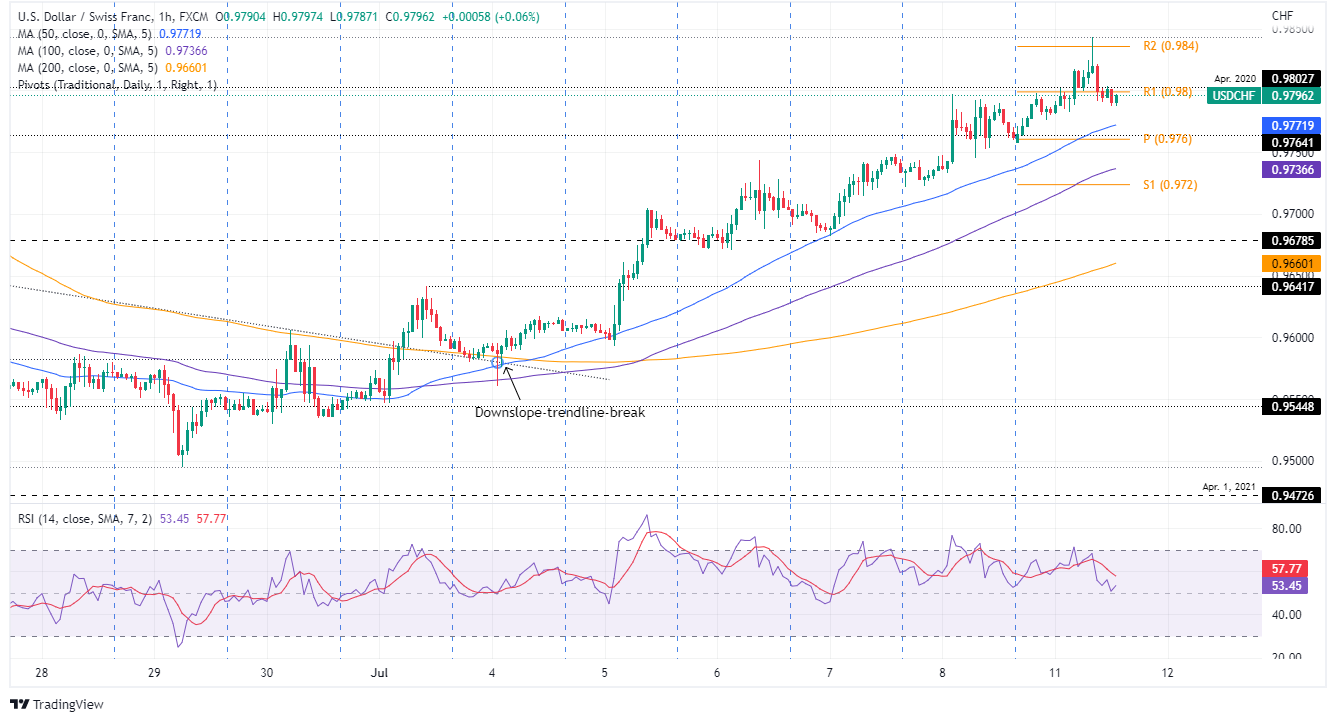
USD/CHF 1-Hour chart
The USD/CHF shows an upward trajectory, aligned with the USD/CHF higher time-frame (HT), being the daily chart. Nevertheless, the rally stalled around the R2 daily pivot, and subsequent pullbacks should be bought, as the major would continue to the upside. USD/CHF traders should be aware that the Relative Strenght Index (RSI) in this time frame, as the pair rallies and retraces, the RSI’s has been seesawing within the 50-70 boundaries without reaching overbought conditions, meaning the uptrend is solid.
Hence, the USD/CHF first resistance would be the R1 pivot point at 0.9800. The break above would expose the R2 daily pivot at 0.9835, followed by the daily high around 0.9843.
USD/CHF Key Technical Levels