- Gold Price Forecast: XAU/USD turns volatile, a pullback looks likely
Market news
Gold Price Forecast: XAU/USD turns volatile, a pullback looks likely
- Gold price has displayed wild moves after surrendering the critical support of $1,732.27.
- The DXY has not displayed reversal signs and aims higher ahead of US Inflation.
- The US Retail Sales are seen meaningfully higher at 0.8% than the prior print of -0.3%.
Gold price (XAU/USD) is displaying wild swings in the Asian session. The precious metal has gyrated in a tad wider range of $1,723.27-1,744.34 in the last two hours of the trading session. No wonder, the volatile move could be a make or break for the asset. Considering the move more precisely, this seems to be a responsive buying action, which takes place when the market participants find the asset a value bet and has soaked entire offers without much effort.
Meanwhile, the US dollar index (DXY) has faced profit-booking after printing a fresh 19-year high at 108.47. The DXY has delivered a stellar performance on expectations of a higher release of the inflation rate. A preliminary estimate for the US Consumer Price Index (CPI) is 8.8%, higher than the prior release of 8.6%. A higher than or within expectation release of the inflation rate will compel the Federal Reserve (Fed) to tighten its policy further and raise interest rates to 2.25-2.50%.
Apart from the US Inflation, US Retail Sales also hold significant importance, which will release on Friday. The economic data is seen meaningfully higher at 0.8% than the prior print of -0.3%.
Gold technical analysis
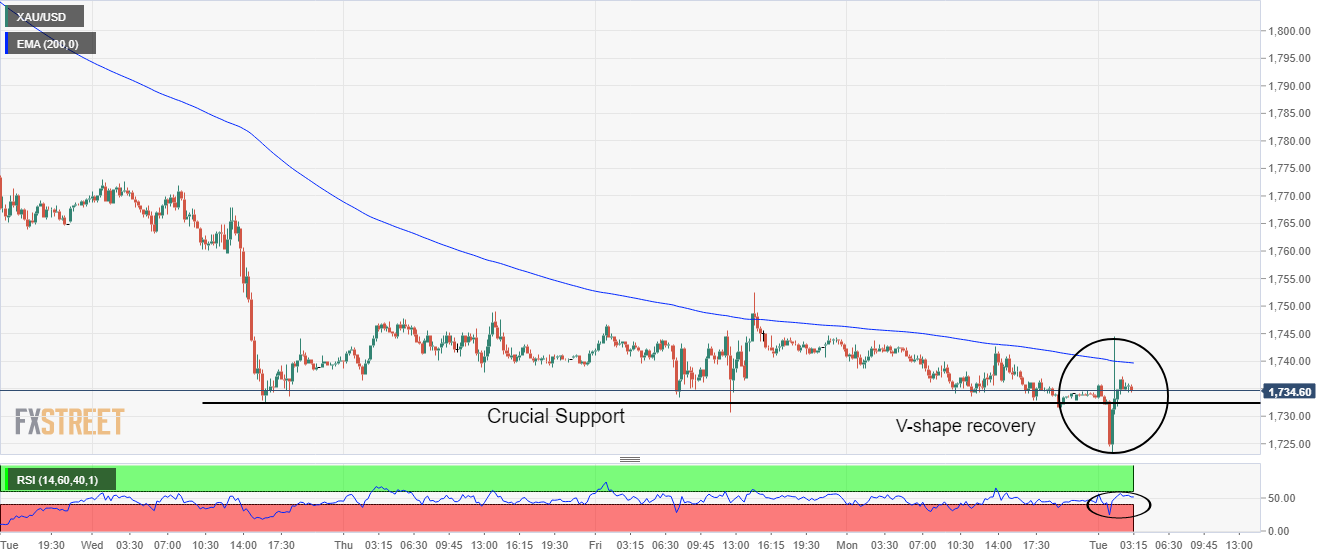
On an intraday scale, the gold prices have witnessed a V-shape recovery after hitting a low of. This V-shape recovery indicates a responsive buying action and is followed by a pullback move. The precious metal has reclaimed the crucial support placed from the previous week’s low at $1,732.27. The bright metal has also attacked the 200-EMA at $1,740.00, however, it failed to sustain above the same. Meanwhile, the Relative Strength Index (RSI) (14) has returned to the 40.00-60.00 range.
Gold intraday chart