- Gold Price Forecast: XAU/USD stays in a charted territory ahead of Fed policy
Market news
Gold Price Forecast: XAU/USD stays in a charted territory ahead of Fed policy
- Gold price is displaying back and forth moves in a $4 range as investors await Fed policy.
- A slowdown in US economic indicators states that the option of a 1% rate hike by the Fed is not viable.
- S&P500 futures have rebounded after displaying losses on Tuesday and may underpin the risk-on again.
Gold price (XAU/USD) has marked its territory and is respecting the levels as investors are awaiting the announcement of the interest rate decision by the Federal Reserve (Fed) for initiating an informed decision. The precious metal is auctioning in a $1,716.00-1,720.00 range and is likely to remain on the sidelines.
Also, the US dollar index (DXY) is replicating an inventory distribution structure after a mild correction at the open. The DXY witnessed a sheer upside move on Tuesday as investors turned cautious ahead of the commentary from Fed chair Jerome Powell on interest rates and further guidance.
Well, the threatened option of 100 basis points (bps) is out of the picture as the US economic indicators are not empowering the Fed to go all in unhesitatingly. However, the option of a 75 bps rate hike is still on its toes and is likely to be dictated. This may elevate the interest rates to 2.25-2.50%.
Meanwhile, S&P500 futures have rebounded overnight after displaying losses on Tuesday. This may support the risk-perceived assets and the DXY may display a downside break.
Gold technical analysis
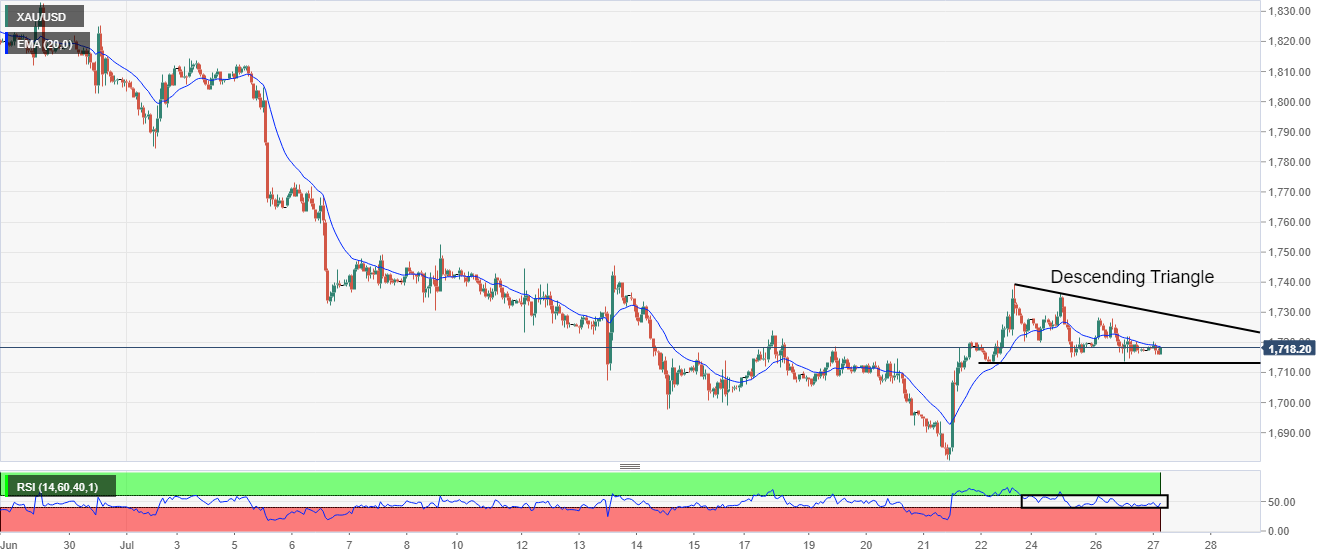
On an hourly scale, the gold price is auctioning in a descending triangle pattern. The downward-sloping trendline of the volatility contraction pattern is placed from July 22 high at $1,739.37. While the horizontal support is placed from July 22 low at $1,712.94. The gold prices are overlapping with the 20-period Exponential Moving Average (EMA) at $1,718.70, which signals a consolidation ahead.
Also, the Relative Strength Index (RSI) (14) is oscillating in the 40.00-60.00 range, which signals that the asset is awaiting potential a trigger for a decisive move.
Gold hourly chart