- Gold Price Forecast: XAU/USD capitalizes Fed’s light hawkish commentary, looks consolidating ahead
Market news
Gold Price Forecast: XAU/USD capitalizes Fed’s light hawkish commentary, looks consolidating ahead
- Gold price is oscillating in a $1,733.12-1,736.00 range after facing feeble barricades at around $1,740.00.
- Fed’s mild hawkish commentary has resulted in an upbeat market mood.
- The DXY has shifted into negative territory after less hawkish guidance from the Fed.
Gold price (XAU/USD) has turned into a consolidating trajectory after a mild correction while attempting to surpass the critical hurdle of $1,740.00. Earlier, the precious metal displayed a juggernaut rally from a low of $1,720.00 after the Federal Reserve (Fed) announced an interest rate hike by a consecutive 75 basis points (bps).
Taking into consideration the soaring price pressures and softening retail demand, Fed chair Jerome Powell decided to maintain the status quo and elevated the interest rates to 2.25-2.50%. Apart from that, the guidance doesn’t seem extremely hawkish as Fed policymakers are seeing interest rates near 3.5% by the end of CY2022.
A mild hawkish commentary from the Fed has turned out to be music to the ears for the gold bulls. This has also underpinned the risk-on market mood as the market participants are joyful that Fed has at least a decent target for this year. Also, the Fed stated that the labor market is extremely solid and the unemployment rate is low, which has supported the Fed to announce rate hikes unhesitatingly.
Meanwhile, the US dollar index (DXY) has plunged below the cushion of 107.00 significantly. The DXY is expected to extend its losses after a downside move below 106.20.
Gold technical analysis
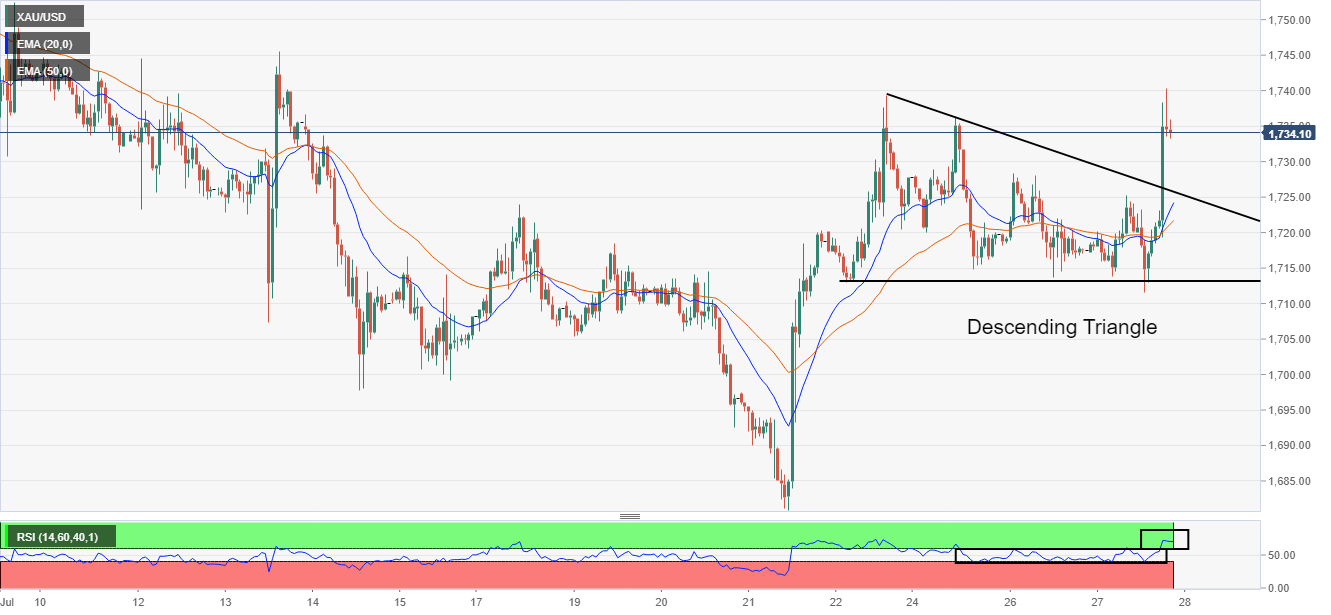
On an hourly scale, the gold price has given an upside break of a descending triangle pattern whose downward-sloping trendline is placed from July 22 high at $1,739.37. While the horizontal support is placed from July 22 low at $1,712.94.
A meaningful bull cross represented by the 20-and 50-period Exponential Moving Averages (EMAs) at $1,719.36, adds to the upside filters.
Meanwhile, the Relative Strength Index (RSI) (14) has shifted into the bullish range of 60.00-80.00, which advocates a sheer upside momentum ahead.
Gold hourly chart