- GBP/USD Price Analysis: Fades bounce off 200-SMA around 1.2150
Market news
GBP/USD Price Analysis: Fades bounce off 200-SMA around 1.2150
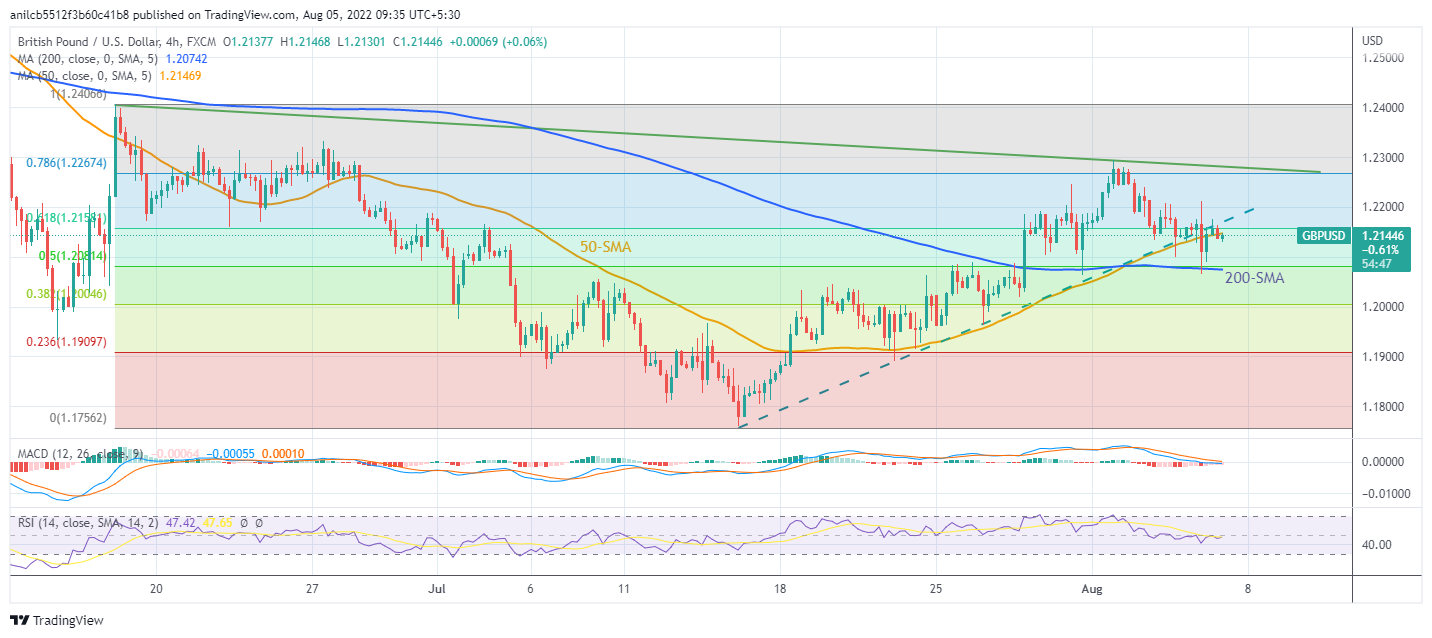
- GBP/USD prints mild losses while keeping the pullback from support-turned-resistance.
- 50-SMA guards immediate upside, 1.2080 appears a tough nut to crack for bears.
- MACD signals, sustained break of three-week-old ascending trend line keep sellers hopeful.
GBP/USD licks its wounds around 1.2150 during early Friday morning in Europe. In doing so, the Cable pair retreats from the 50-SMA while fading the bounce off the 200-SMA.
The quote broke an upward sloping trend line from mid-July the previous day and stays below the same since then. The sustained trading below the previous key support joins downbeat MACD signals and a pullback from the 50-SMA to favor bears.
However, a convergence of the 200-SMA and a 50% Fibonacci retracement of the June-July downside, near 1.2080, appears strong support to crack for the bears before convincing the markets.
It’s worth noting that the early July swing high near 1.2055 can act as a validation point for the GBP/USD south-run targeting the multi-month low marked on July 14, at 1.1760.
Alternatively, recovery moves initially jostle with the 50-SMA level of 1.2150 before challenging the previous support line near 1.2170.
Even if the GBP/USD prices manage to cross the 1.2170 hurdle, a downward sloping resistance line from June 16, close to 1.2285, could challenge the bulls.
GBP/USD: Four-hour chart

Trend: Further weakness expected