- EUR/JPY Price Analysis: Dives sharply below 137.00 as risk appetite improves
Market news
EUR/JPY Price Analysis: Dives sharply below 137.00 as risk appetite improves
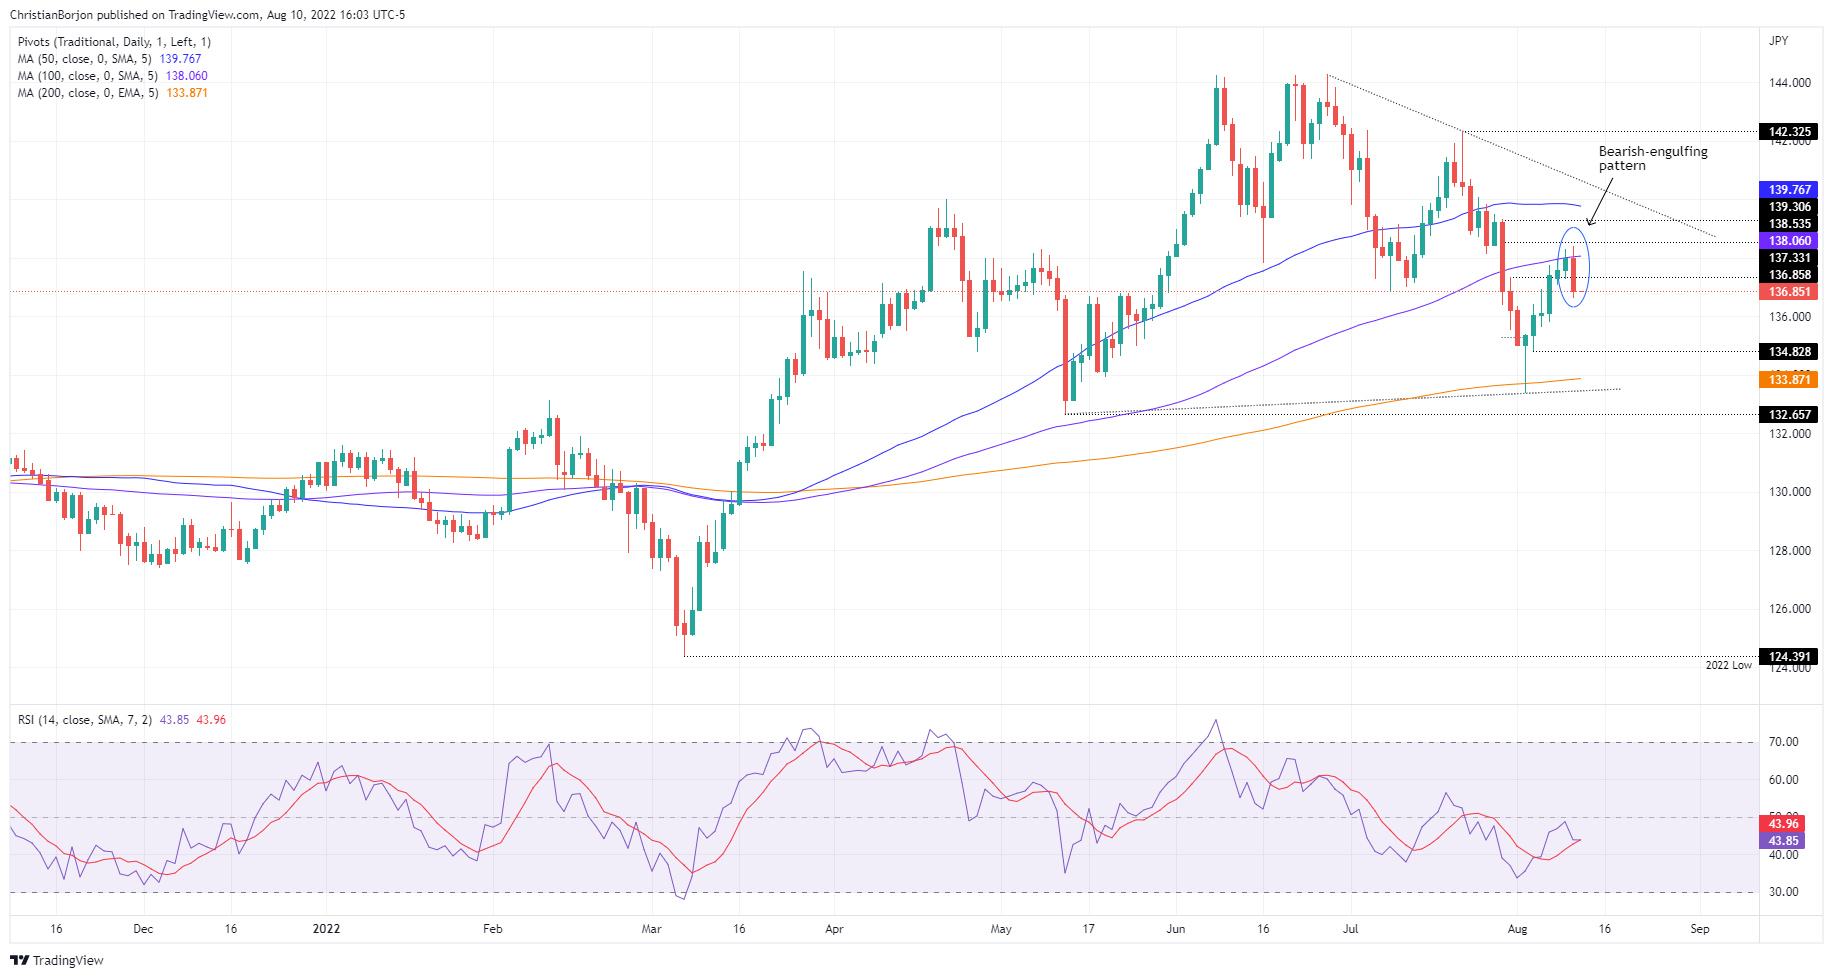
- EUR/JPY daily chart forms a bearish-engulfing candle pattern with bearish implications.
- In the short-term, the EUR/JPY might print a leg-up before extending the downtrend.
The EUR/JPY plunged on Wednesday due to a risk-on impulse spurred by US inflation data, which ticked lower, dissipating the Federal Reserve’s need for an aggressive tightening. The reaction was that the US 10-year bond yield retraced, dragging the USD/JPY. Hence, the EUR/JPY followed suit, diving more than 100 pips towards its daily low at 136.94. At the time of writing, the EUR/JPY is trading at 136.86, down 0.81%.
EUR/JPY Price Analysis: Technical outlook
From a daily chart perspective, the EUR/JPY is forming a bearish-engulfing candle pattern, meaning that sellers outweighed buyers. Additionally, the cross-currency tumbled below the 100-day EMA at 138.03 and, at the time of writing, is testing the August 4 high at 136.92, previous resistance-turned-support. If the latter is broken, that will keep sellers in the driver’s seat, paving the way for further losses.
 EUR/JPY Daily chart
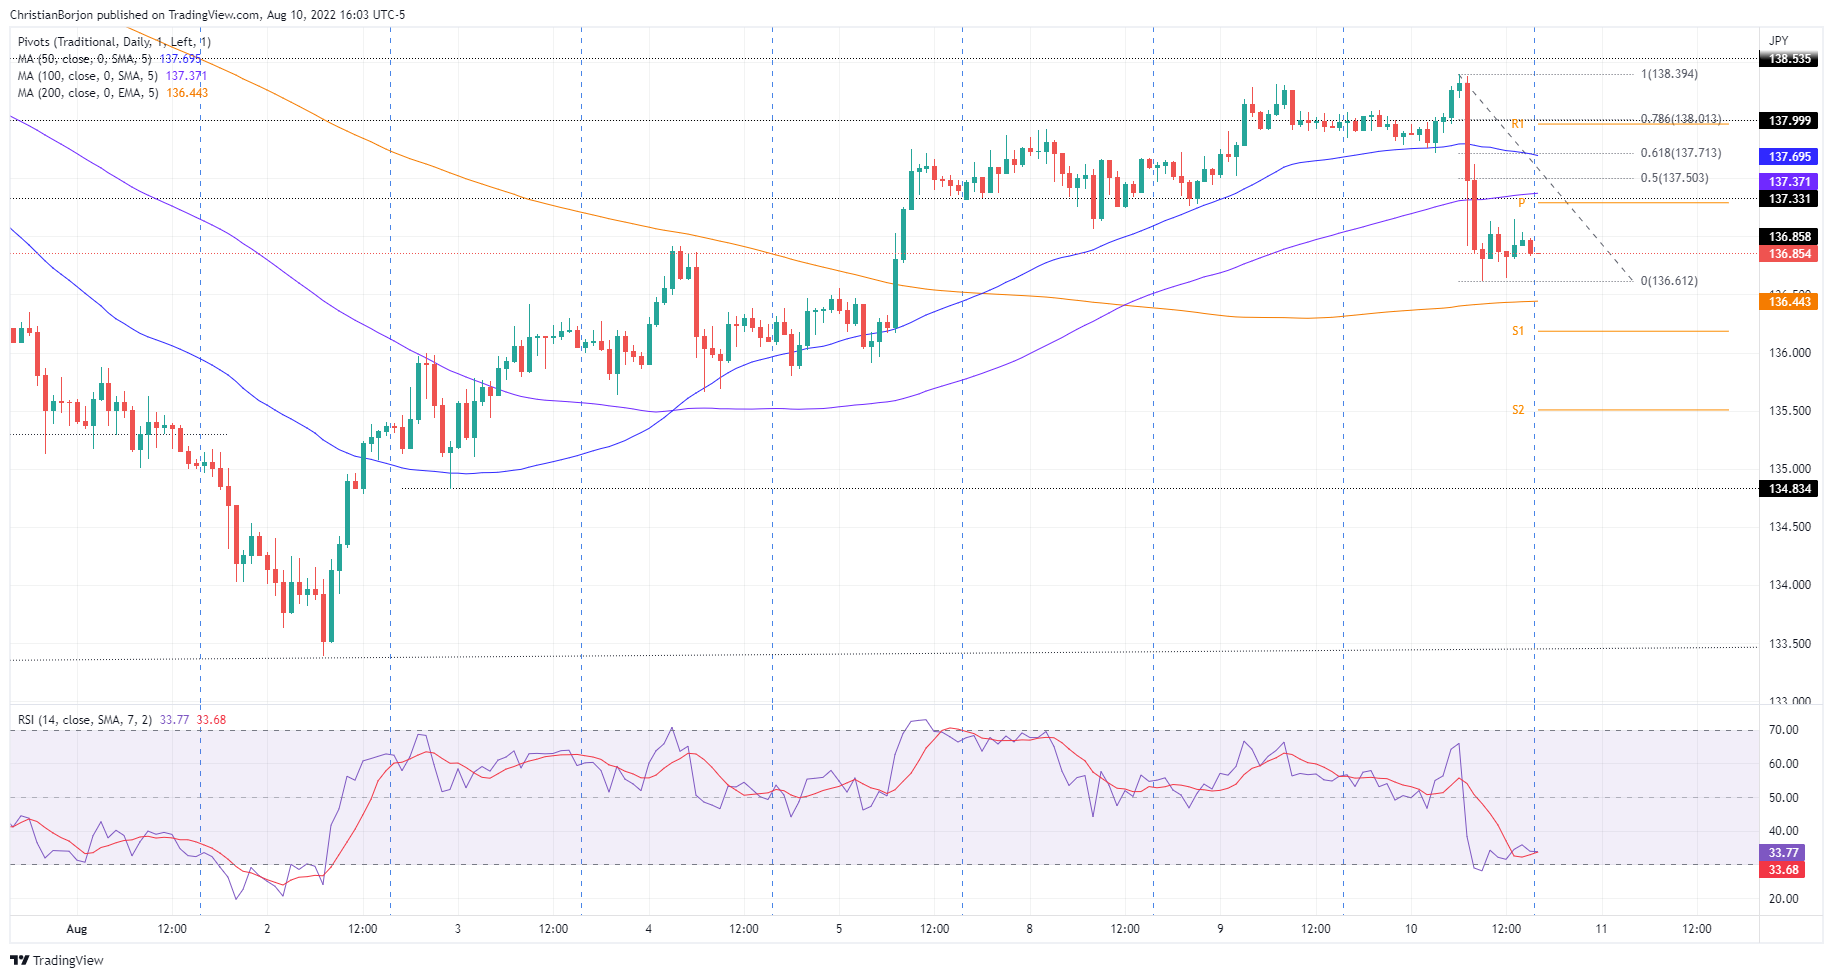
Short-term, the EUR/JPY hourly chart, illustrates the pair as neutral-upwards, but prices falling below the weekly opening price of 137.32, might pave the way for further losses. The downtrend seems to lose steam as the Relative Strength Index (RSI) entered oversold conditions, which means that the EUR/JPY might print a leg-up towards the 50% Fibonacci retracement at 137.50 before resuming the downtrend.
If the above scenario plays out, the EUR/JPY first support would be the 137.00 figure. Once cleared, the next support level will be the August 10 low at 136.61, followed by the 200-hour EMA at 136.44, before sliding to the psychological 136.00 figure.
 EUR/JPY Hourly chart
EUR/JPY Key Technical Levels