- AUD/JPY Price Analysis: Refreshes two-week highs above 94.50 on mood improvement
Market news
AUD/JPY Price Analysis: Refreshes two-week highs above 94.50 on mood improvement
- The AUD/JPY is trading near two-week highs around 94.66.
- Risk appetite is mixed, as shown by Wall Street, finishing mixed.
- In the short-term, the AUD/JPY could test 95.00; otherwise, a fall towards the 100-EMA is on the cards.
The AUD/JPY snaps two days of losses and advances after Wall Street closed mixed as investors’ upbeat sentiment pauses. Earlier risk appetite improved due to US PPI data, which showed that inflation on the producer’s side is also cooling. So traders asses that the previously-mentioned data, alongside Wednesday’s US CPI, might ease Fed pressures to tackle inflation, meaning a less aggressive tightening. At the time of writing, the AUD/JPY is trading at 94.53, up 0.47%.
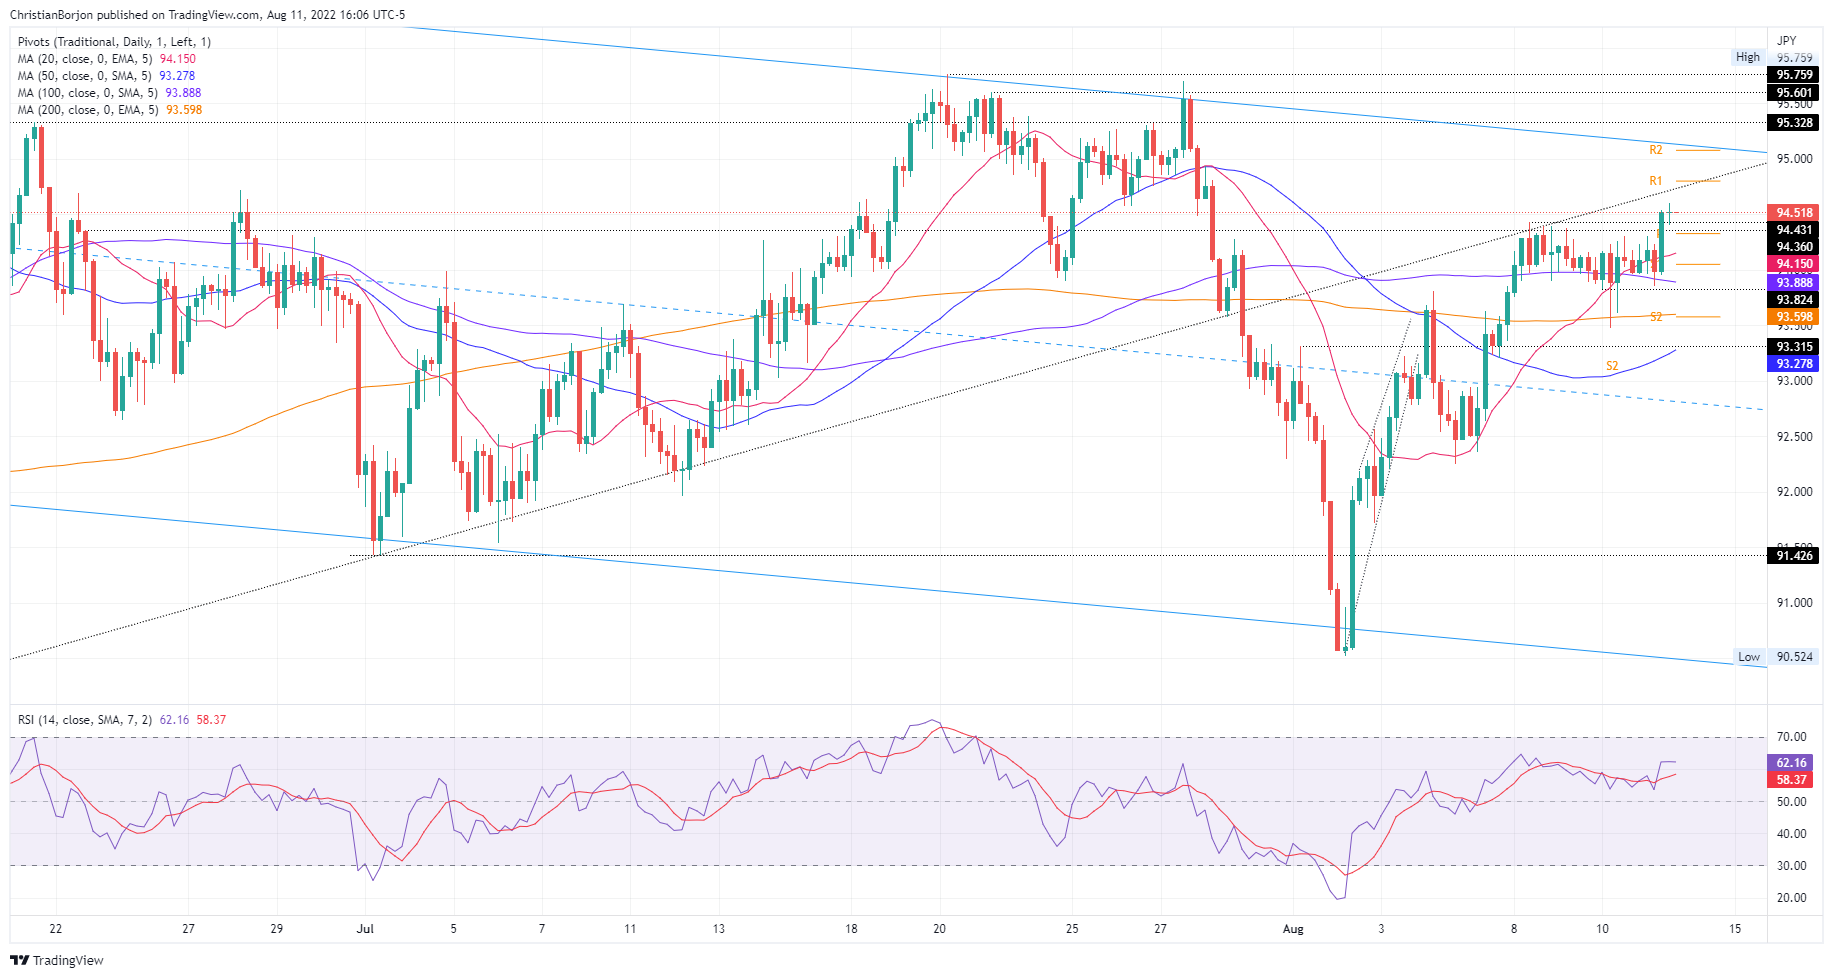
AUD/JPY Price Analysis: Technical outlook
The AUD/JPY daily chart illustrates buyers reclaiming control. On Thursday, the AUD/JPY hit a two-week high at 94.60, followed by a retracement due to a three-month-old upslope trendline-turned-resistance, which was challenging to overcome. Nevertheless, the Relative Strength Index (RSI) is still aiming upwards, meaning buyers are gathering momentum.
Zooming into the 4-hour scale, the AUD/JPY is neutral-to-upward biased, but the uptrend appears to be losing steam. The intersection of the R2 daily pivot with the previously mentioned three-month-old upslope trendline is solid resistance around the 94.50-80 area. A breach of the latter will expose the figure at 95.00, followed by the July 27 daily high at 95.70.
On the flip side, if the AUD/JPY breaks below the 94.00 mark, the first support would be the 200-EMA at 93.60, previous to testing the August 10 pivot low at 93.48-
 AUD/JPY 4-hour chart
AUD/JPY Key Technical Levels