- USD/JPY Price Analysis: Bears are stepping on the gas and a move to 135.50 could be on the cards
Market news
USD/JPY Price Analysis: Bears are stepping on the gas and a move to 135.50 could be on the cards
- USD/JPY is meeting daily resistance, and a break of the hourly trendline support would expose 137 the figure.
- A break below there could open the way for a move below 136.80 towards 135.50.
USD/JPY bears are moving in and the following illustrates the prospects of a sizeable move to the downside to correct a significant portion of the recent rally in the US dollar.
USD/JPY daily chart
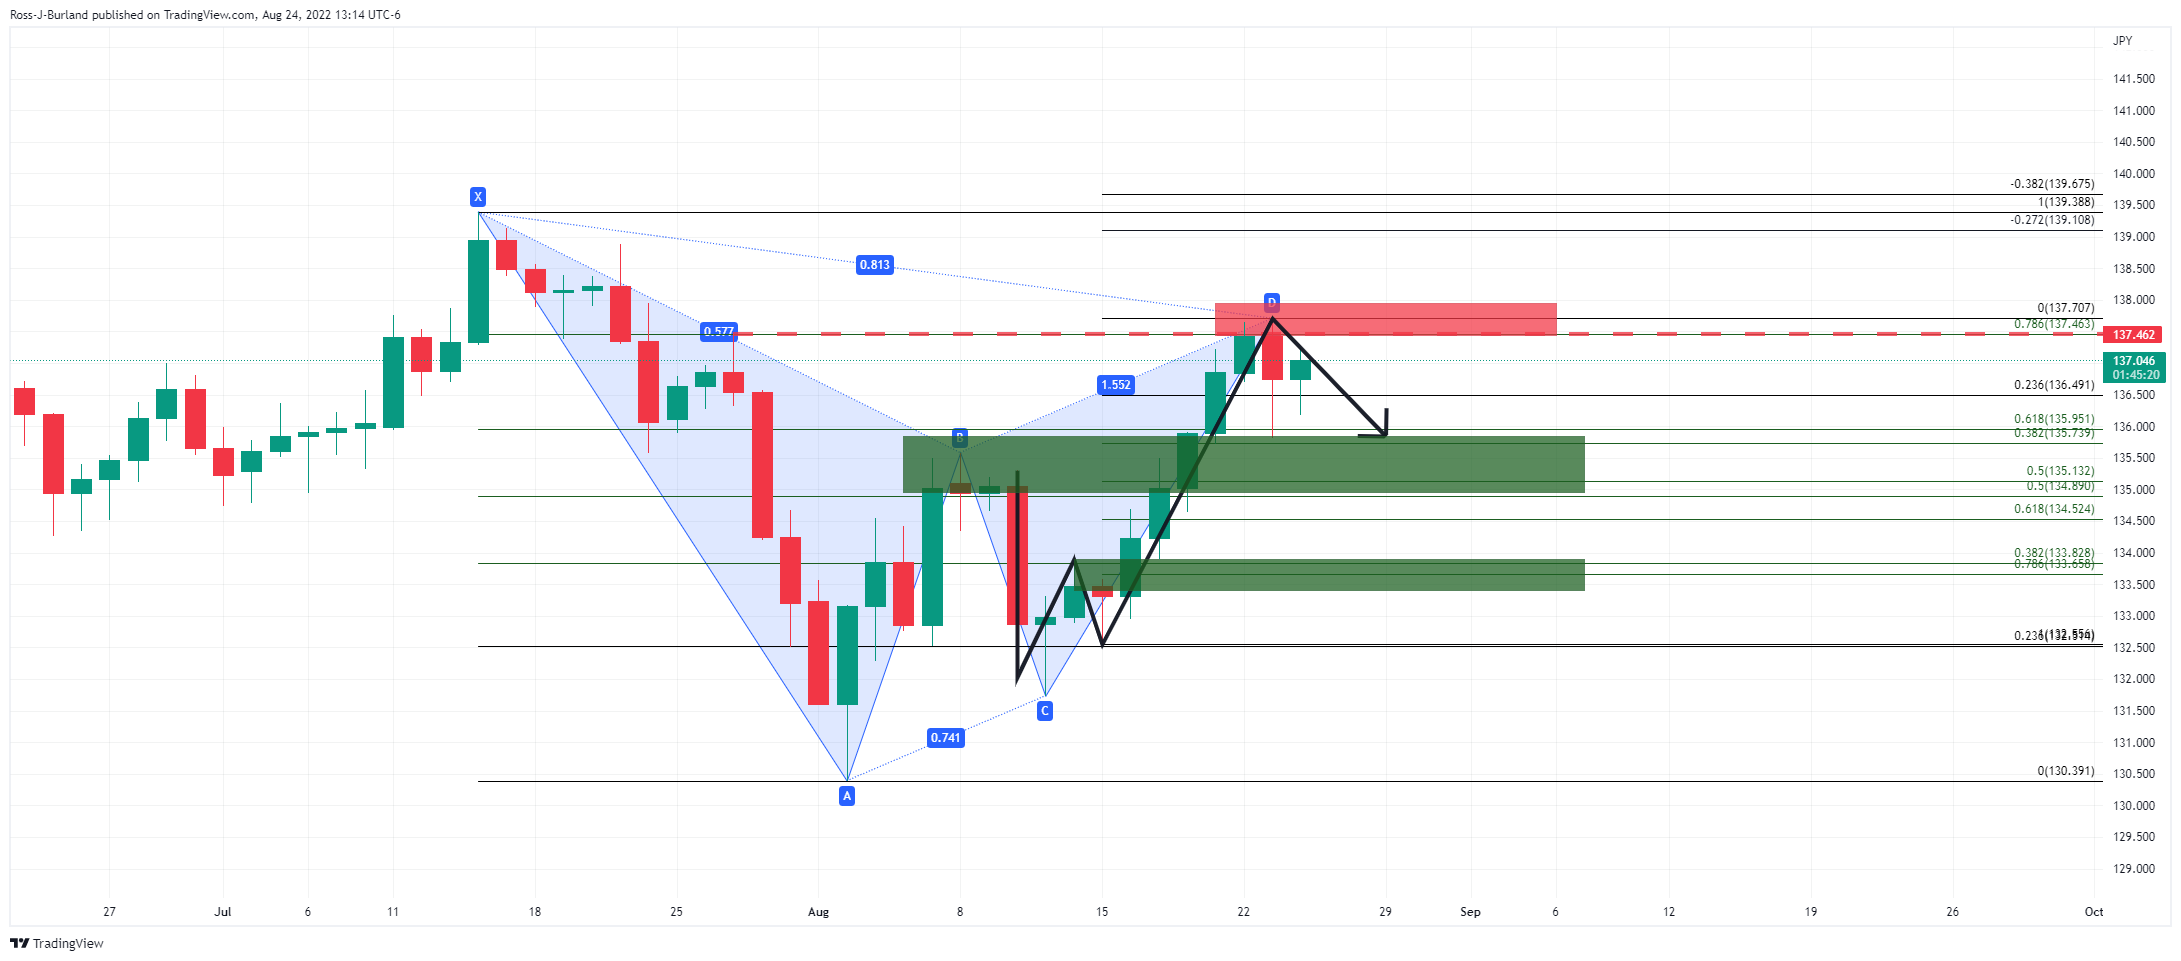
The Gartley pattern offers resistance around 137.50 which leaves the focus on the downside and back towards the pattern's neckline. This also aligns with the W-formation's 38.2% and 50% ratios. Zooming down to the hourly chart, we can see that the price is moving out of the bullish trend as follows:
USD/JPY H1 chart
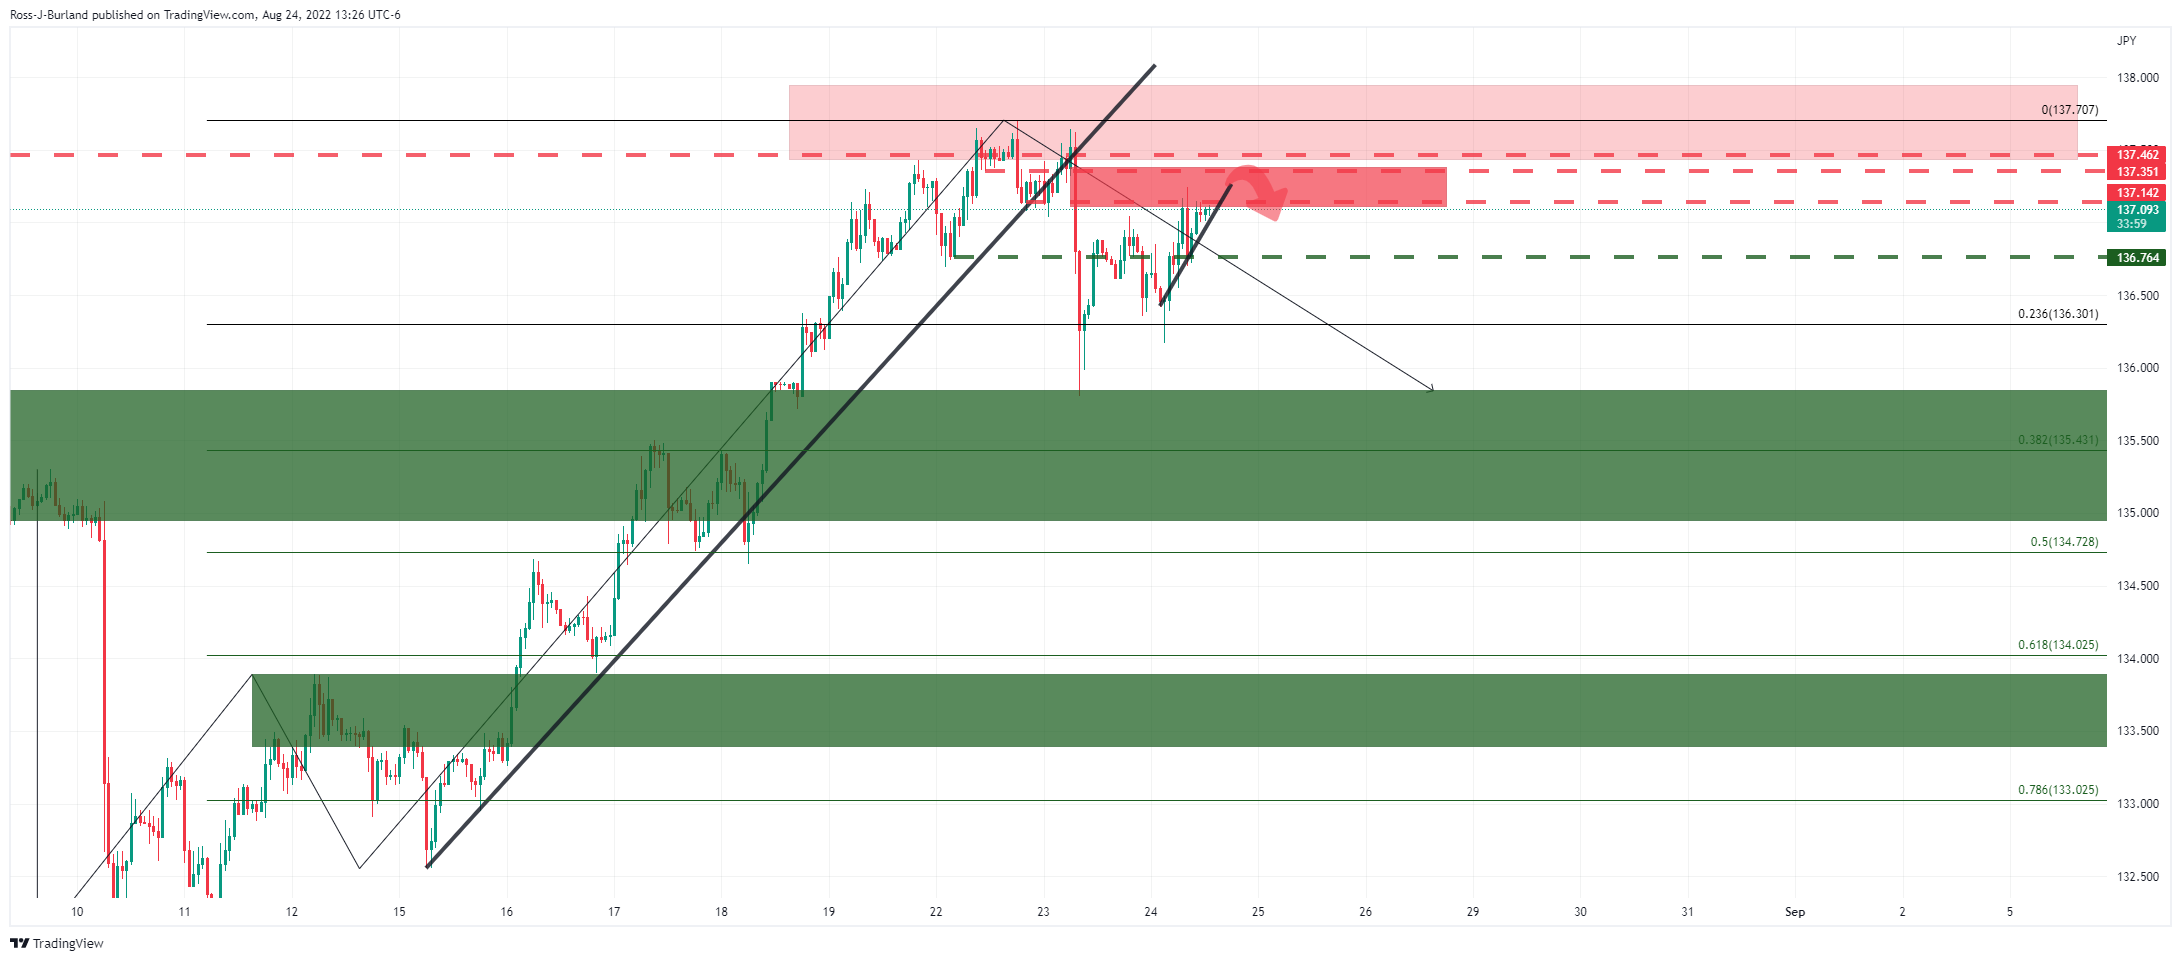
The price moved out of the trend and is now coming back into to restest the old supports, counter trendline and now resistance area. Zooming in further, we can see the price is attempting to move out of a sub trend:
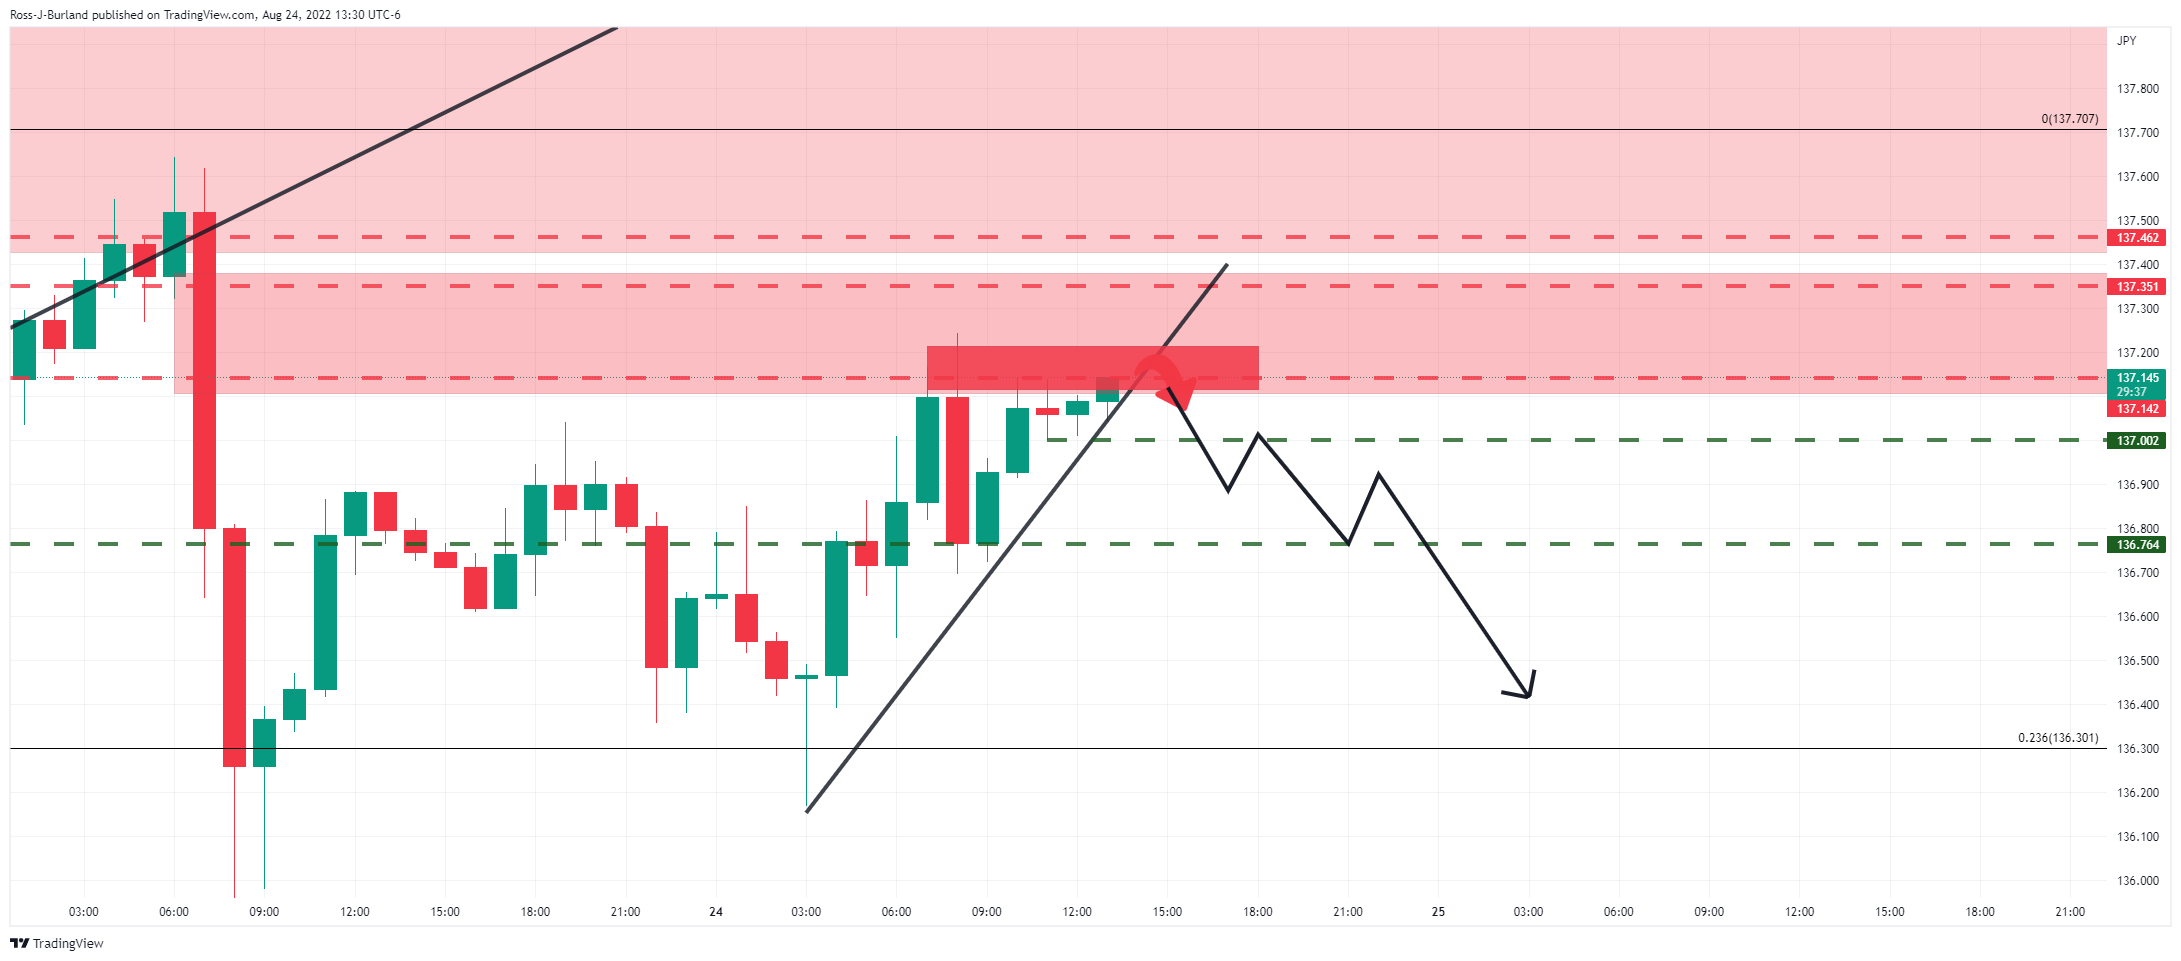
A break of the trendline support would expose 137 the figure. A break below there could open the way for a move below 136.80 and set off a waterfall sell-off for the days ahead, in accordance with the daily bearish scenario towards 135.50.