- Gold Price Forecast: XAU/USD aims establishment above $1,750, DXY stabilizes ahead of Jackson Hole
Market news
Gold Price Forecast: XAU/USD aims establishment above $1,750, DXY stabilizes ahead of Jackson Hole
- Gold price is aiming to scale up its auctioning territory above $1,750.00.
- The DXY has turned sideways as investors await Jackson Hole Economic Symposium.
- The Fed is expected to continue its pace of hiking interest rates further.
Gold price (XAU/USD) is displaying a lackluster performance as it is hovering around the critical hurdle of $1,750.00. On a broader note, the precious metal is auctioning in an inventory adjustment phase after a firmer rebound from Tuesday’s low of $1,727.85.
The US dollar index (DXY) has also turned sideways around 108.60 despite a weak performance on the US Durable Goods Orders data front. The economic data landed a 0%, lower than the forecast of 0.6% and the prior release of 2.2%. Looks like, the market participants are purely focusing on the commentary from Federal Reserve (Fed) chair Jerome Powell at Jackson Hole Economic Symposium.
After the release of the downbeat US Purchasing Managers Index (PMI) economic data on Tuesday, the think tanks were dictating that the Fed might slow down its pace of hiking interest rates. As a contraction in economic activities is a consequence of vigorous interest rate hikes, Fed may trim the extent of a rate hike.
However, commentary from Minneapolis Fed Bank President Neel Kashkari has faded the rumors. Fed policymaker believes that the inflation rate above 8% is a big reason to worry and the Fed will stick to its path of bringing price stability sooner.
Gold technical analysis
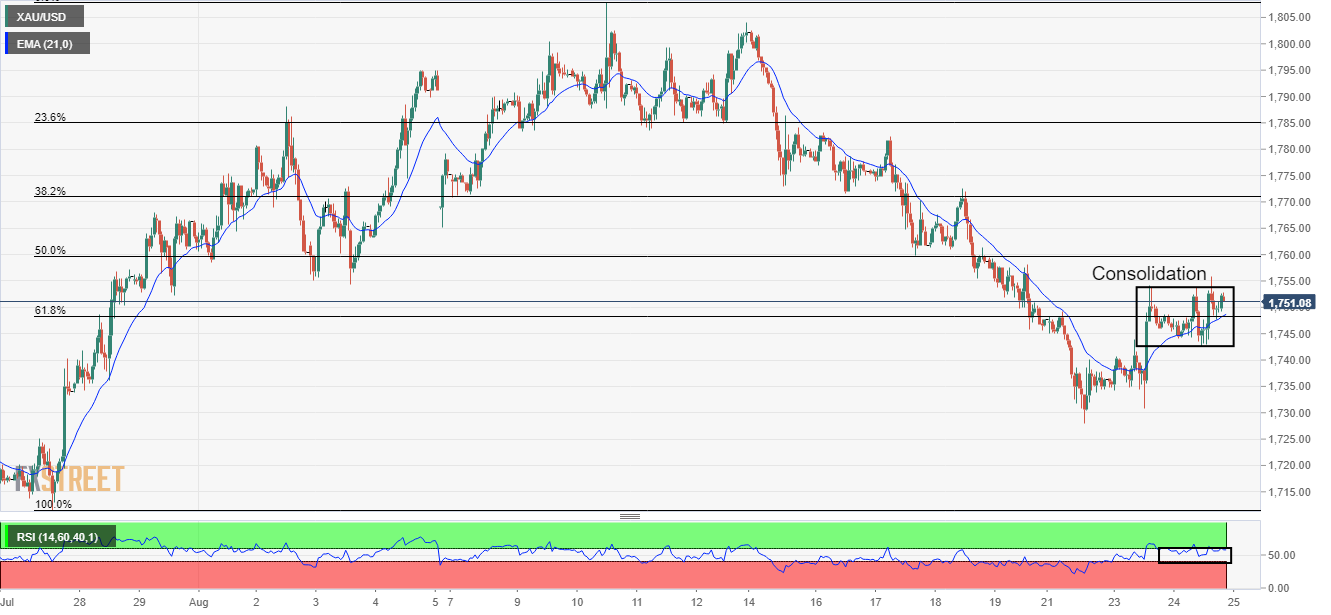
Gold prices are displaying topsy-turvy moves in a tad wider range of $1,742.90-1,753.85 after establishing above the 61.8% Fibonacci retracement (placed from July 27 low at $1,711.53 to August 10 high at $1,807.93) at $1,748.38 on an hourly scale.
The precious metal is comfortably auctioning above the 20-period Exponential Moving Average (EMA) at $1,749.00, which validates a short-term uptrend.
Meanwhile, the Relative Strength Index (RSI) is attempting to shift into the bullish range of 60.00-80.00. The momentum oscillator is hovering around 60.00.
Gold hourly chart