- AUD/USD Price Analysis: Bulls eye 0.6950 for Thursday's business, bears need to get below 0.6880
Market news
AUD/USD Price Analysis: Bulls eye 0.6950 for Thursday's business, bears need to get below 0.6880
- AUD/USD bulls getting set for a significant move.
- The bears need to break 0.6900 and then 0.6880.
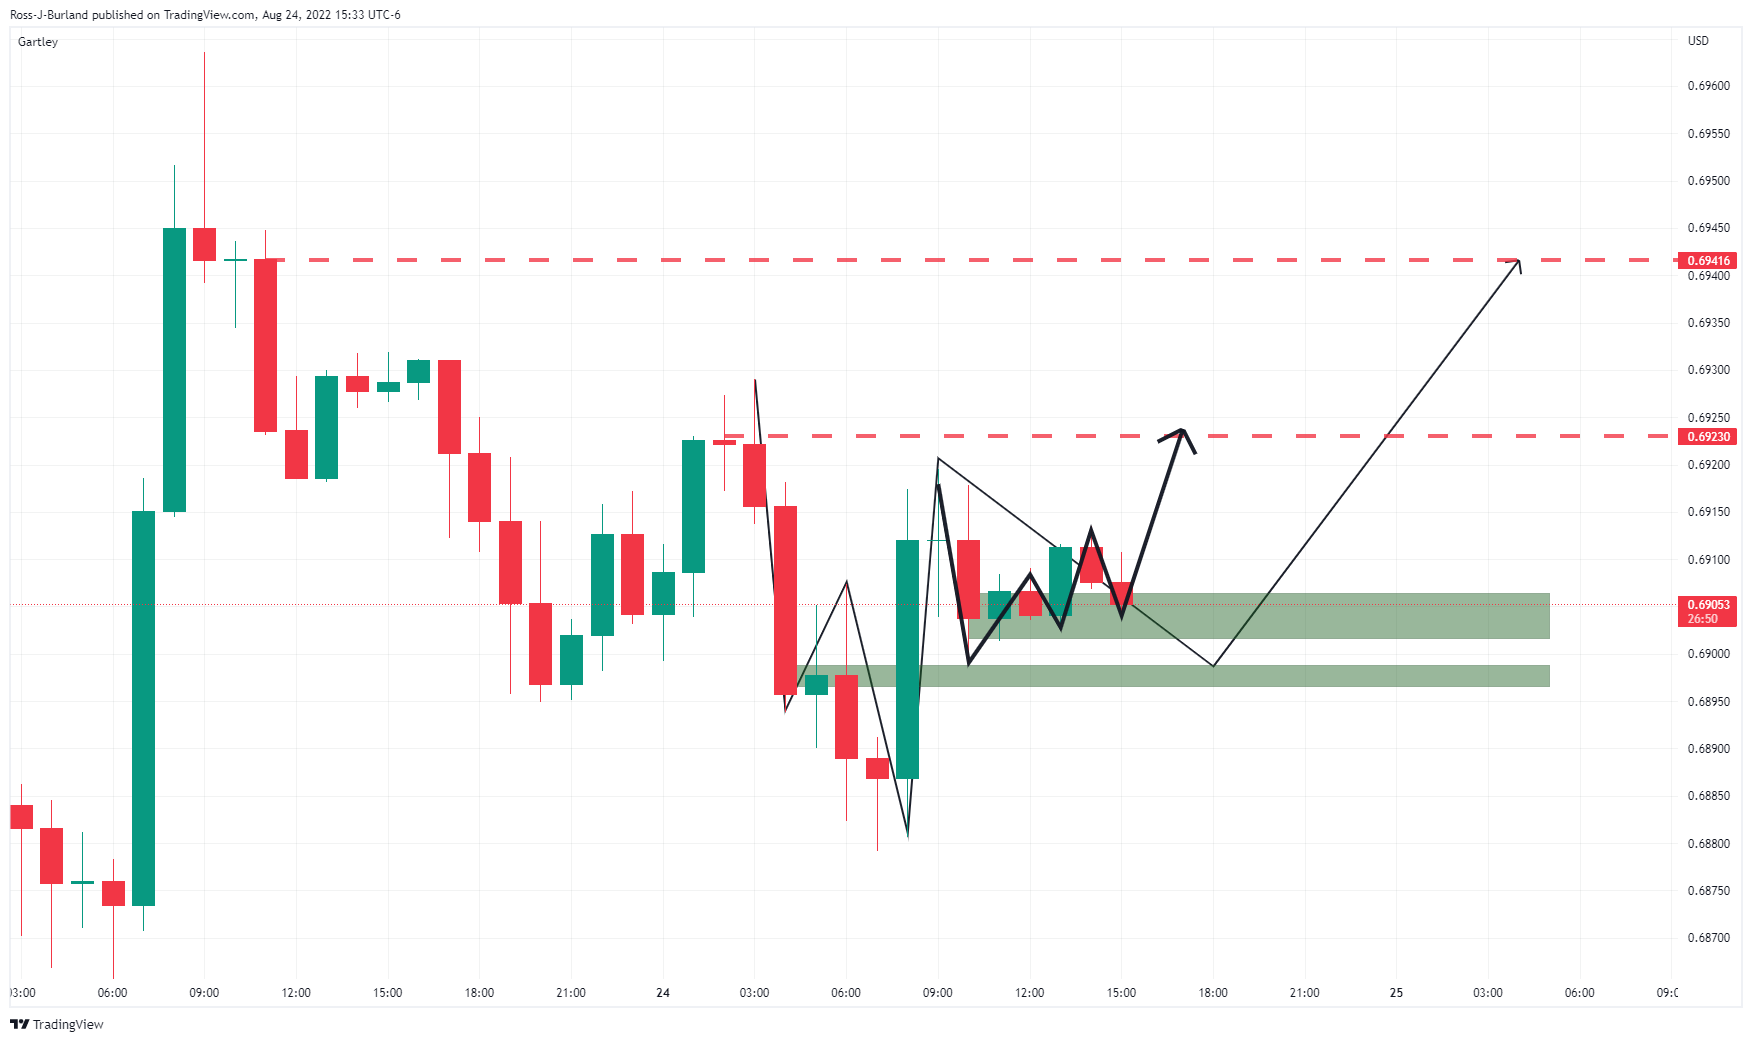
AUD/USD has been bottoming on the charts with a move below 0.69 the figure from where it has formed a peak bullish formation and bulls will be looking to engage from within 0.69 again for a bust higher over the course of the forthcoming sessions. The money is above the various swing pints on the hourly time frame:
AUD/USD H1 charts

The Gartley pattern is a bullish feature on the chart whereby the target aligns with a 78.6% Fibonacci retracement o the current corrective range between recent highs and lows of 0.6965 and 0.6880. The prior structure aligns with this target as being the 0.6945/50 area on the chart. The resistance until there are 0.6912, 0.6922 and 0.6931.
The W-formations are bottoming patterns where the price has, so far, been supported by the necklines. This is bullish for the Tokyo open and the day ahead. On the other hand, a break below these necklines, 0.6906, 0.6896 and then the 0.6880 lows will be bearish.