- USD/CHF Price Analysis: Double-top in the 4-hour chart, targets 0.9500
Market news
USD/CHF Price Analysis: Double-top in the 4-hour chart, targets 0.9500
- USD/CHF from a long-term perspective remains upward biased, though solid resistance around 0.9700 sent the pair lower.
- Double-top in the 4-hour chart, to keep the pair below the 0.9700 figure, the highest high of August.
The USD/CHF marches firmly as Wall Street closes, finishing Monday’s session with gains of 0.16%, after hitting a daily high around the 0.9700 figure above August’s 23 high at 0.9692. Still, solid resistance at the latter dragged prices down towards the 0.9670s region at the time of writing.
USD/CHF Price Analysis: Technical outlook
The USD/CHF daily chart illustrates the major facing support at the 100-day EMA at 0.9665, which, once cleared, would pave the way to further losses. The Relative Strength Index (RSI) at 58.26, stays in bullish territory, though almost flat, meaning that consolidation lies ahead. Unless the USD/CHF records a decisive break below 0.9600 or above the 0.9700 figure, the USD/CHF will remain range-bound.
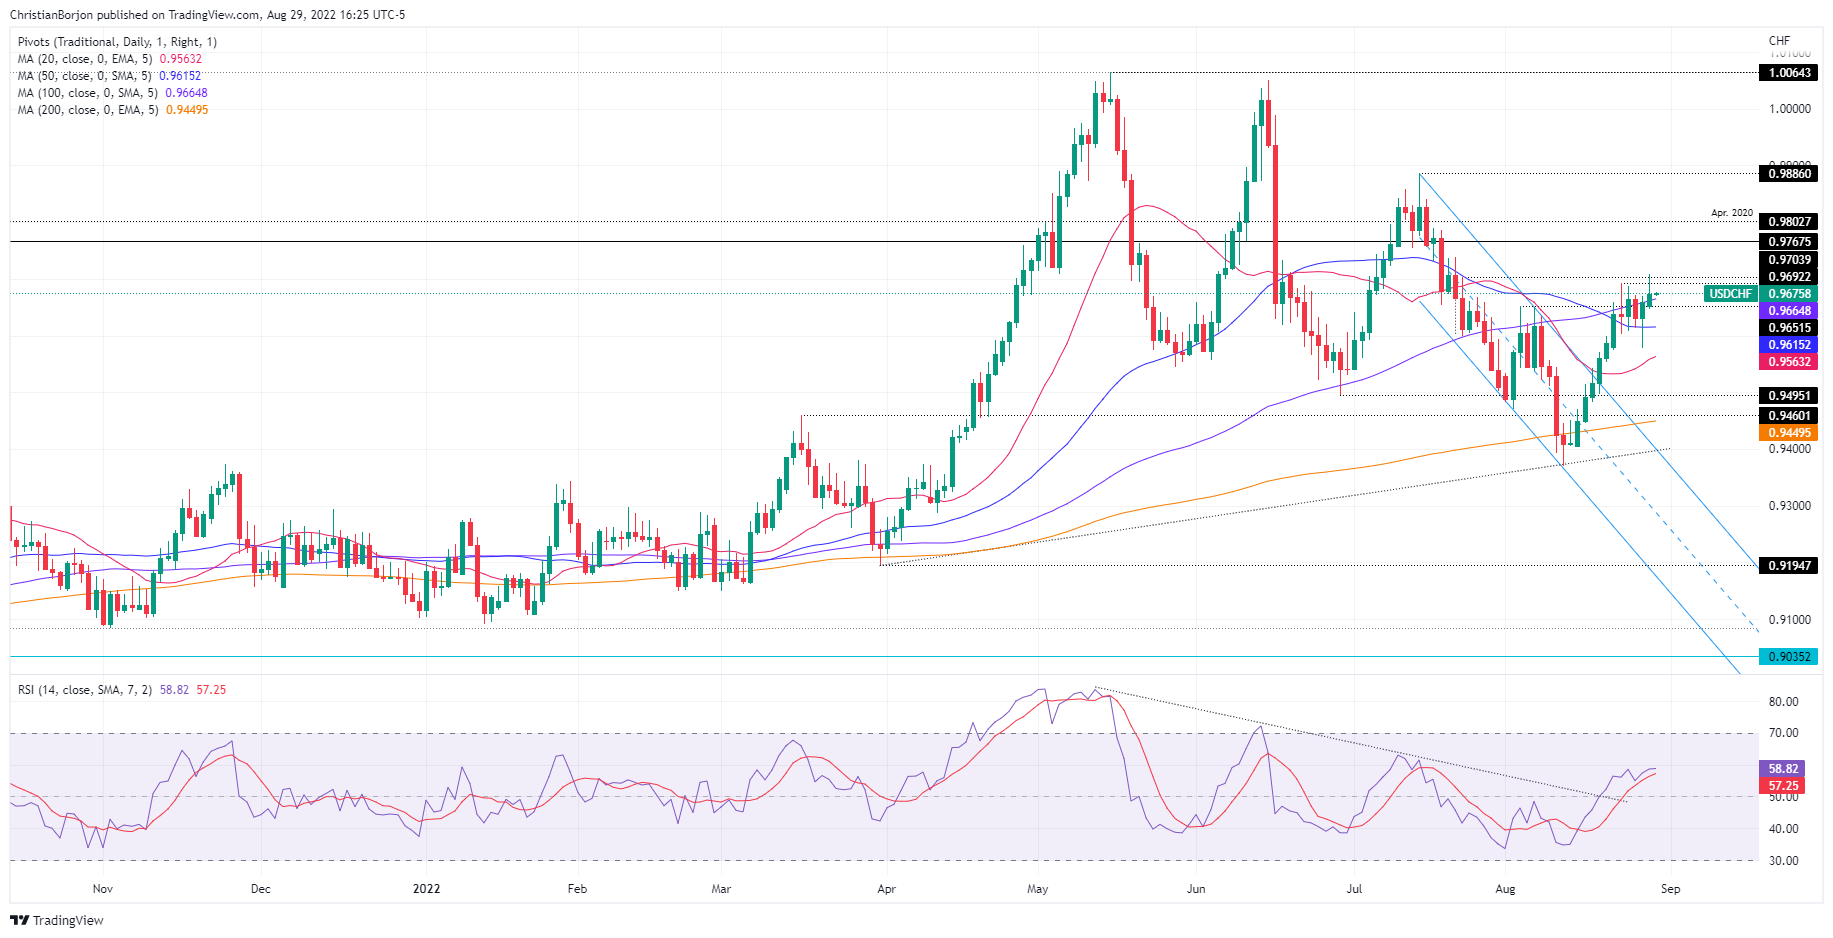 USD/CHF Daily chart
When looking at the 4-hour scale, the USD/CHF formed a double-top in the 0.9700 figure, suggesting that the Swiss franc might strengthen soon, targeting the 0.9500 figure. Oscillators have a downslope, with the RSI being in bullish territory, approaching the 50-midline, meaning a cross under would indicate sellers gaining momentum.
Therefore, the USD/CHF first support would be the S1 daily pivot at 0.9640. A break below will expose the S2 pivot point at 0.9610, immediately followed by the 200-EMA at 0.9600.
 USD/CHF 4-hour chart
USD/CHF Key Technical Levels