- GBP/JPY Price Analysis: Consolidated in the 161.00-162.80 range, amid the lack of catalyst
Market news
GBP/JPY Price Analysis: Consolidated in the 161.00-162.80 range, amid the lack of catalyst
- On Monday, the GBP/JPY rallied 0.65%, bouncing from last week’s lows towards the 162.00 mark.
- GBP/JPY will shift bullish-biased if it breaks above the 163.00 mark.
- A decisive break below 161.80 will open the door for the GBP/JPY towards 160.00.
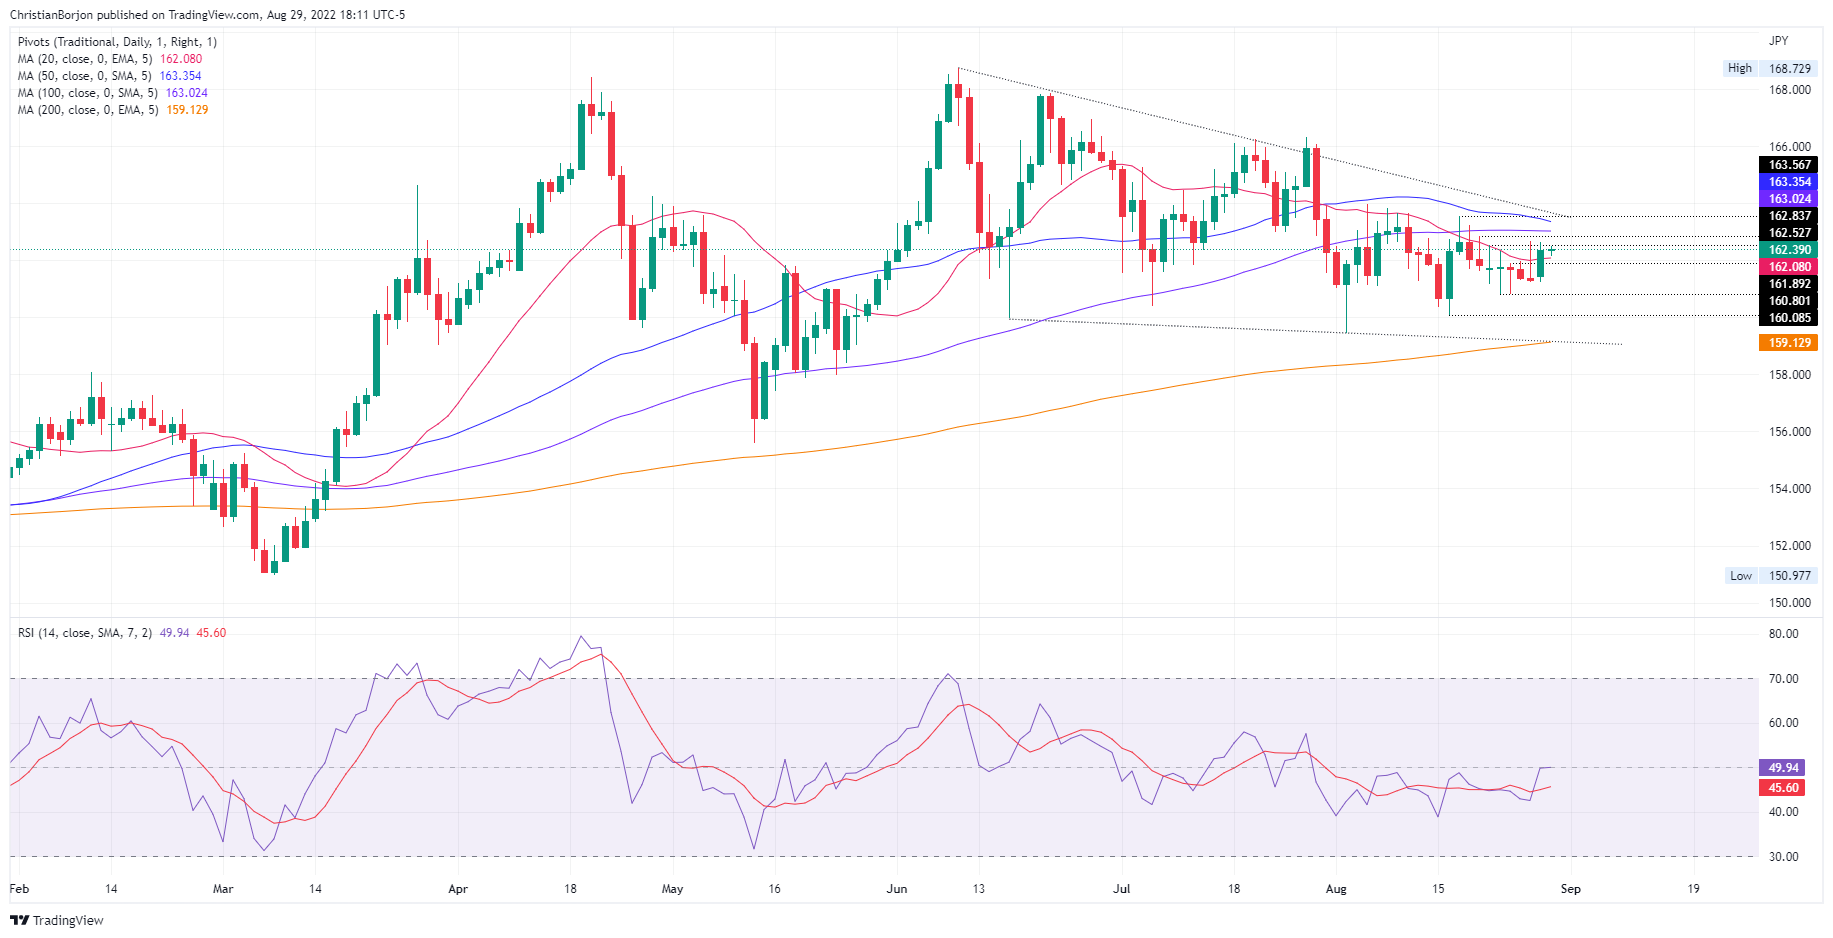
The GBP/JPY pares some of its Friday losses and edges slightly higher as the Asian Pacific session begins. However, it remains trapped in the 160.80-162.83 area, unable to break beyond those boundaries for eight consecutive days. At the time of writing, the GBP/JPY is trading at 162.40.
GBPJPY Price Analysis: Technical outlook
The GBP/JPY daily chart illustrates the 162.80 resistance as a solid supply zone, ahead of the 100 and the 50-day EMAs, each at 163.02 and 163.35, respectively. Also, the Relative Strength Index (RSI) slope is horizontal, further cementing the pair’s consolidation for the last 14 days.
If the GBP/JPY breaks above 162.80, it will expose the 100 and 50-day EMAs on the upper side. Once cleared, the next stop will be a three-month-old downslope trendline, drawn from the YTD highs around 168.00, which passes around the 163.70 area, ahead of the 164.00 mark.
On the other hand, the GBP/JPY’s first support would be the 20-day EMA at 162.08. The break below will expose the August 23 daily low at 161.82, followed by the August 16 low at 160.08.
GBPJPY Key Technical Levels