- Silver Price Analysis: XAG/USD prints falling wedge, recovery remains elusive below $19.50
Market news
Silver Price Analysis: XAG/USD prints falling wedge, recovery remains elusive below $19.50
- Silver price fades bounce off monthly low inside a bullish chart formation.
- Convergence of 200-SMA, 50% Fibonacci retracement level challenges the buyers.
- Sellers have a bumpy road to travel near the yearly low.
- Oscillators hint at the further grinding towards the south.
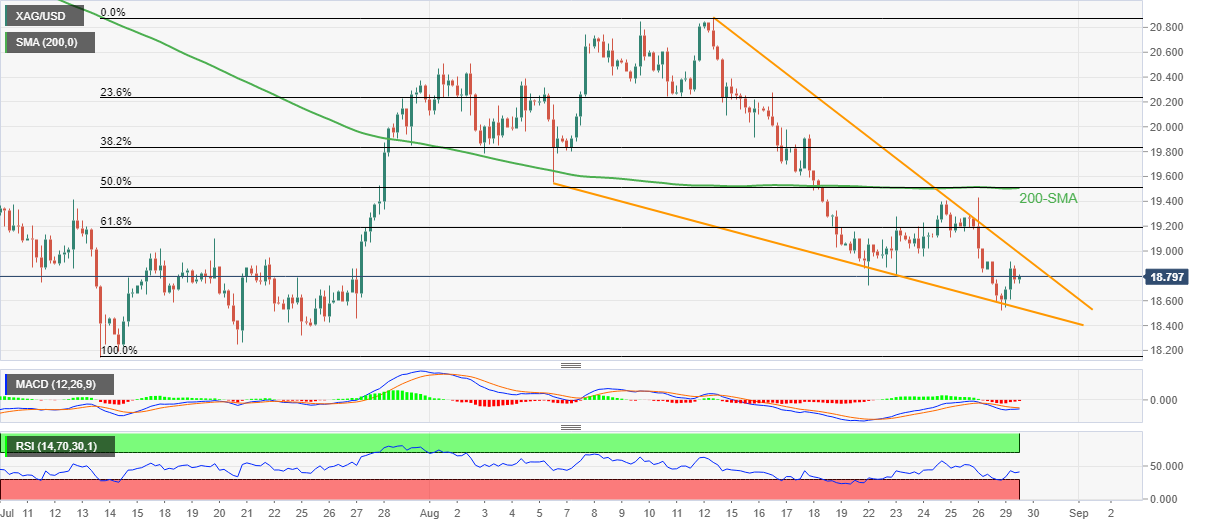
Silver price (XAG/USD) remains sidelined at around $18.80 during Tuesday’s Asian session, after bouncing off the five-week low the previous day. In doing so, the bright metal seesaws inside the three-week-old falling wedge bullish chart pattern.
It’s worth noting, however, that the bearish MACD signals and sluggish RSI (14) challenge the upside momentum.
That said, the quote’s recovery needs to cross the $19.00 hurdle to confirm the falling wedge bullish chart pattern. Even so, a confluence of the 200-SMA and the 50% Fibonacci retracement of the metal’s July-August upside, near $19.50, appear a tough nut to crack for the XAG/USD bulls.
If the XAG/USD prices rally beyond $19.50, the $20.00 threshold could test the buyers during the theoretical upside targeting $21.50.
Alternatively, pullback moves may initially confront the stated wedge’s support line, at $18.55 by the press time.
Following that, there are multiple supports near $18.50 and $18.30-25 that could challenge the silver bears before directing them to the yearly low near $18.15 marked in July.
Silver: Four-hour chart
Trend: Further weakness expected