- EUR/USD Price Analysis: Bulls seek validation from 200-HMA, adjacent triangle
Market news
EUR/USD Price Analysis: Bulls seek validation from 200-HMA, adjacent triangle
- EUR/USD picks up bids to poke the key upside hurdle.
- 200-HMA, upper line of the descending triangle highlight 1.0005 as important resistance.
- Two-week-old descending trend line adds to the resistance.
- Steady RSI, bearish MACD signals hint at further grinding of prices towards the north.
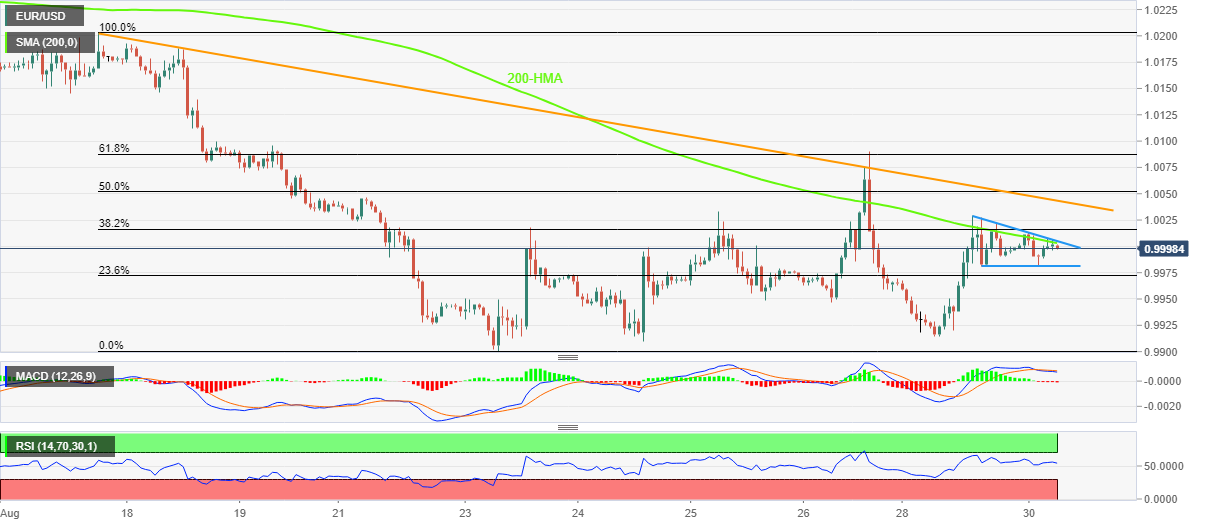
EUR/USD buyers struggle to keep the week-start rebound heading into Tuesday’s European session. In doing so, the major currency pair jostles with the 200-HMA and upper line of the nearby descending triangle bullish chart pattern.
It’s worth noting, however, that the RSI (14) remains sidelined and the MACD flashes bearish signals to challenge the upside momentum. Even so, the quote’s refrain from declining below the 0.9980 support keeps intraday buyers hopeful.
That said, the intraday run-up needs validation from the 1.0005 resistance confluence including the aforementioned HMA and the triangle’s top line.
Even so, a downward sloping resistance line from August 17, close to 1.0050 by the press time, could test the EUR/USD buyers. Also acting as an upside hurdle is the 61.8% Fibonacci retracement level of August 17-23 fall, near 1.0090.
Alternatively, a clear downside break of the stated triangle’s support line, close to 0.9980 at the latest, could recall the pair sellers. Following that, a south-run towards the 0.9900 threshold can’t be ruled out.
In a case where EUR/USD remains bearish past 0.9900, the lows marked during September and October 2002, respectively near 0.9685 and 0.9610, could lure the pair sellers.
EUR/USD: Hourly chart
Trend: Limited recovery expected