- USD/CAD Price Analysis: Hits seven-week highs above 1.3100, as a rising-wedge looms
Market news
USD/CAD Price Analysis: Hits seven-week highs above 1.3100, as a rising-wedge looms
- USD/CAD is climbing sharply, above 1.3100, as a rising wedge threatens to drag the spot price below 1.3100.
- Solid resistance around 1.3110 could pave the way for a USD/CAD fall below the 1.3100 figure.
The USD/CAD rallied to seven-week highs, above the 1.3100 figure, but retreated as buyers lacked the strength to hold the fort above the latter during the North American session. At the time of writing, the USD/CAD is trading at 1.3103, up 0.71%.
USD/CAD Price Analysis: Technical outlook
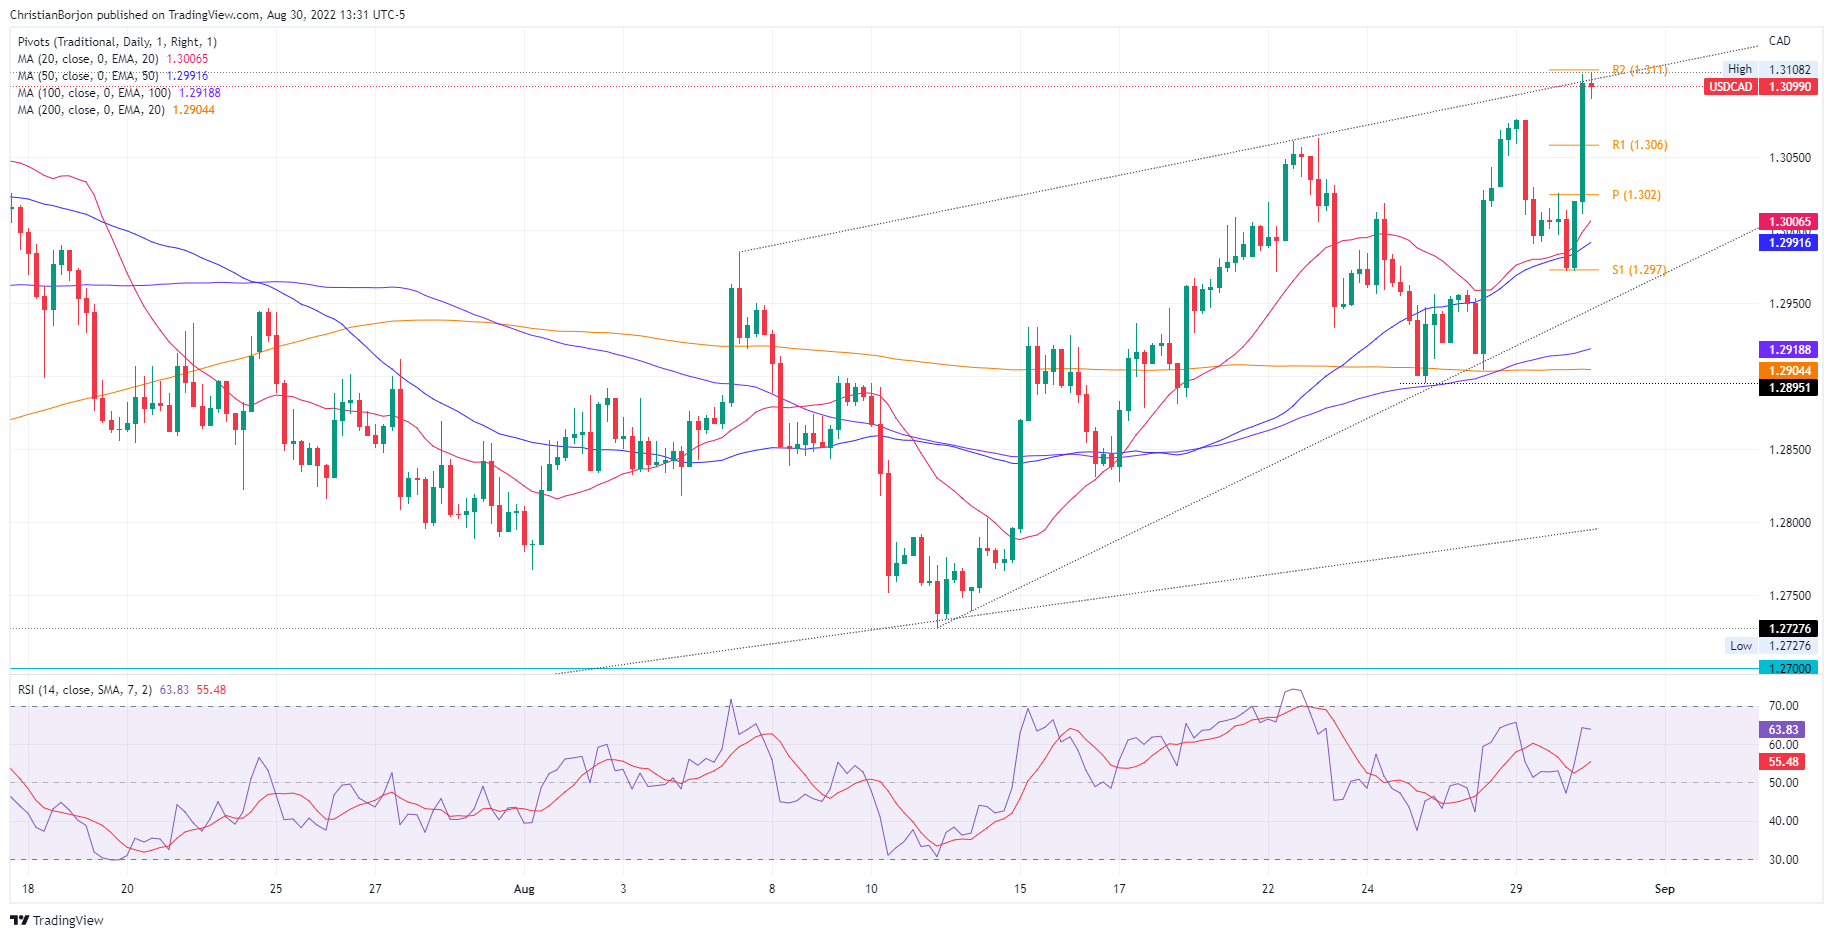
The USD/CAD daily chart depicts the pair in a solid uptrend as buyers decisively conquered the 1.3000 mark when the major hit a daily high at 1.3108, but a pullback keeps the major around the 1.3090s area. If the USD/CAD achieves a daily close above 1.3100, that will pave the way for a re-test of the YTD highs at 1.3223. Otherwise, the major could consolidate in the 1.3000-1.3100 area ahead of the Bank of Canada’s (BoC) monetary policy meeting on September 7.
It is worth noting that a rising wedge in the daily chart formed, meaning that short-sellers could be adding to their positions, as the “wedge” targets a fall towards 1.2770.
Short term, the USD/CAD 4-hour chart portrays a negative divergence between price action and the Relative Strength Index (RSI(. While the USD/CAD is trending up, with successive series of higher highs/lows, the RSI’s last peak is lower than the previous, meaning buyers are losing steam. Aldo, the weekly high facing the R2 daily pivot at 1.3110, opened the door for a pullback.
Therefore, the USD/CAD first support would be the 1.3100 figure. Once cleared, the next demand zone would be the R1 daily pivot at 1.3060, followed by the daily pivot point at 1.3020.
USD/CAD Key Technical Levels