- GBP/JPY Price Analysis: Bounces off a double-bottom in the H1, targets 162.00
Market news
GBP/JPY Price Analysis: Bounces off a double-bottom in the H1, targets 162.00
- GBP/JPY daily chart shows the pair trading sideways due to the lack of fresh impetus.
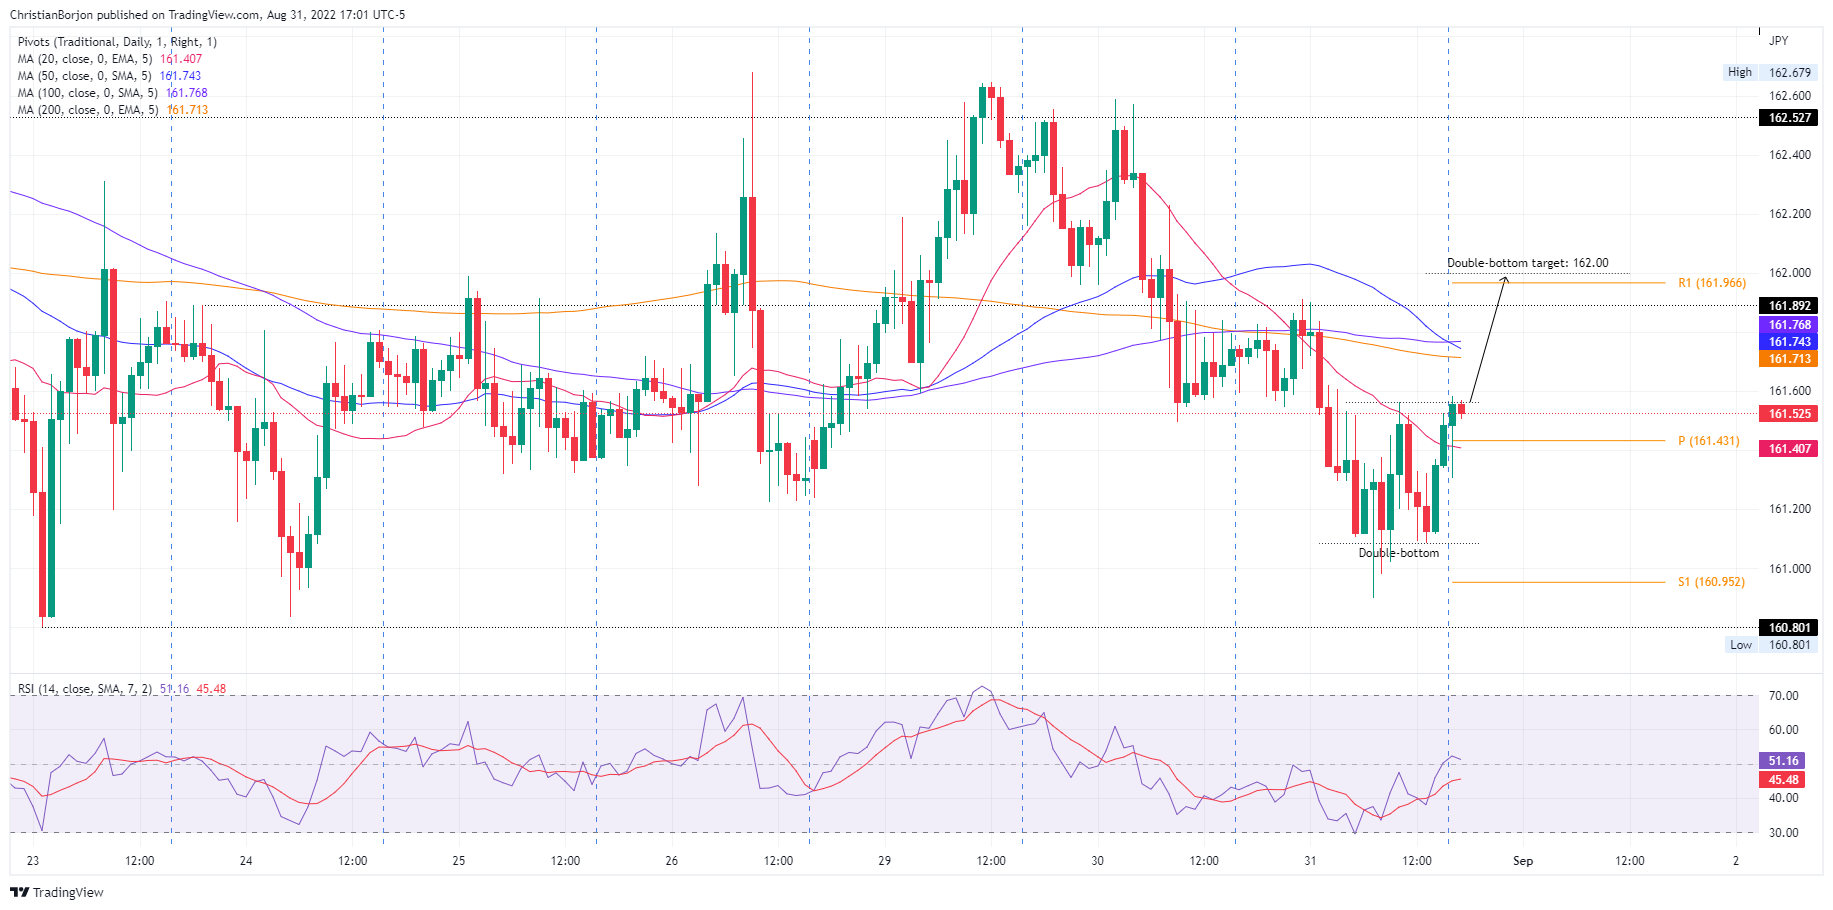
- Near-term, the hourly chart formed a double-bottom, targeting 162.00.
The GBP/JPY extended its losses for the second straight day, stumbling below the 20-day EMA at 162.00, striking a new weekly low at 160.90. However, the British pound staged a recovery late in the session and trimmed earlier losses. The GBP/JPY is trading at 161.52, below its opening price as the Asian Pacific session begins.
GBP/JPY Price Analysis: Technical outlook
From a technical perspective, the GBP/JPY remains sideways. During the last 22 days, the cross-currency remains in the 159.44-162.84 range, unable to crack above/below it due to fundamental reasons linked to both currencies. The Relative Strength Index (RSI) paints a dull picture, trapped in the 38-49 reading, in bearish territory, directionless. Therefore, GBP/JPY intraday price action could be more entertaining.
Short term, the GBP/JPY one-hour chart illustrates the formation of a double-bottom on Wednesday, which targets the 162.00 mark. Nevertheless, the cross-currency pair would find crucial supply zones on its way north.
The GBP/JPY first resistance would be the 200-EMA at 161.71. Break above will expose the confluence of the 50 and 100-EMAs in the 161.75-76 area, followed by the R1 daily pivot at 161.96, ahead of the double-bottom’s target.
GBP/JPY Key Technical Levels