- Gold Price Forecast: XAU/USD bulls remain hopeful whilst above $1,710 – Confluence Detector
Market news
Gold Price Forecast: XAU/USD bulls remain hopeful whilst above $1,710 – Confluence Detector
- Gold price stages a comeback as the US dollar corrects amid a risk-on mood.
- Investors reposition after Powell’s speech, ahead of next week’s US inflation.
- XAU/USD looks to $1,725 and $1,734 so long as $1,710 support holds.
Gold price is attempting a rebound from the $1,700 region once again, as the US dollar resumes its correction from two-decade highs amid the return of risk-on flows. The US Treasury yields take a breather but hold near multi-year high, as Fed Chair Jerome Powell cemented a 75 bps September Fed rate hike, with markets now pricing an 85% probability. Powell maintained that the Fed remains committed to bringing inflation down while warning against prematurely loosening policy during a Q&A presented by the Cato Institute on Thursday. The end-of-the-week flows and the market’s position readjustments ahead of next week’s US inflation data also offer a fresh boost to the yellow metal.
Also read: Gold Price Forecast: Will XAU/USD confirm a falling channel breakout?
Gold Price: Key levels to watch
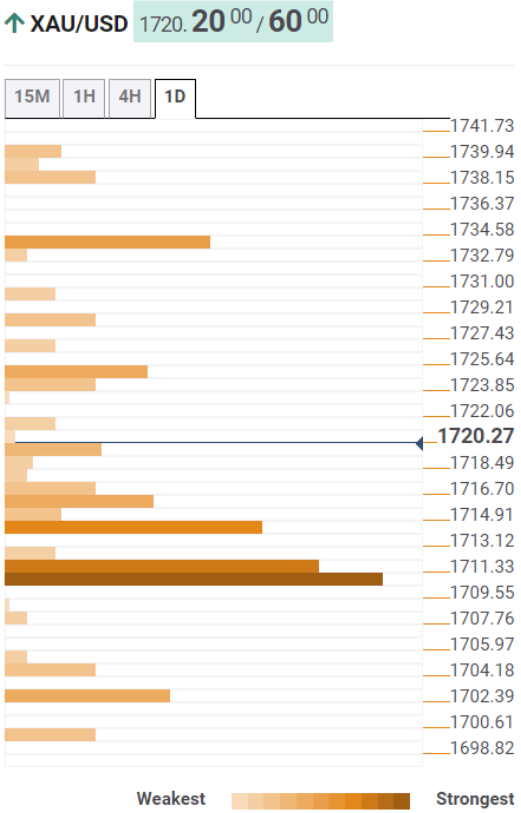
The Technical Confluence Detector shows that the gold price is looking to continue with its recovery mode, eyeing the powerful resistance at $1,725, which is the Fibonacci 61.8% one-week.
Bulls will then challenge the previous day’s high of $11,728, above which a fresh upswing toward the Fibonacci 23.6% one-month at $1,734 will be on the cards.
On the flip side, the Fibonacci 61.8% one-day at $1,719 offers immediate support, below which sellers will target strong support around the $1,715, which is the convergence of the Fibonacci 38.2% one-day and SMA10 four-hour.
The next critical support is seen at the confluence of the Fibonacci 38.2% one-week, SMA5 one-day and the previous month’s low at $1,710.
A sustained move below the latter will open a fresh downside towards the previous day’s low of $1,704.
Here is how it looks on the tool
About Technical Confluences Detector
The TCD (Technical Confluences Detector) is a tool to locate and point out those price levels where there is a congestion of indicators, moving averages, Fibonacci levels, Pivot Points, etc. If you are a short-term trader, you will find entry points for counter-trend strategies and hunt a few points at a time. If you are a medium-to-long-term trader, this tool will allow you to know in advance the price levels where a medium-to-long-term trend may stop and rest, where to unwind positions, or where to increase your position size.