- Gold Price Forecast: XAU/USD turns sideways after a decline from $1,690, Fed’s guidance spoils mood
Market news
Gold Price Forecast: XAU/USD turns sideways after a decline from $1,690, Fed’s guidance spoils mood
- Gold price has turned sideways after a solid volatile session amid Fed monetary policy announcement.
- Fed’s hawkish guidance on interest rates has spoiled the market mood.
- The DXY is advancing to recapture its fresh two-decade high at 111.58.
Gold price (XAU/USD) is displaying back-and-forth moves in a narrow range of $1,670.33-1,674.78 in the early Tokyo session. The precious metal is having a sigh of relief after a volatile session amid Federal Reserve (Fed) monetary policy meeting. A firmer rebound from around a two-year low at $1,654.00, followed by an extreme sell-off around $1,690.00 and now a volatility contraction is building a base for a decisive move ahead.
Fed chair Jerome Powell has hiked the interest rates as expected by 75 basis points (bps), escalating it to 3.00-3.25% with the old objective of bringing price stability. However, the roadmap plotted to tame the roaring inflation through policy tightening has spilled blood on Wall Street.
With the ultimate target of 4.6% terminal rates to combat inflationary pressures and reaching 4.4% by next year, the roadmap for wiping out add-over inflation seems gloomy for the growth outlook, employment opportunities, and wage rates.
Meanwhile, the US dollar index (DXY) is aiming to recapture the fresh two-decade high at 111.58, recorded on Wednesday. The asset is expected to sustain at elevated levels until signs of legitimate decline in the Consumer Price Index (CPI).
Gold technical analysis
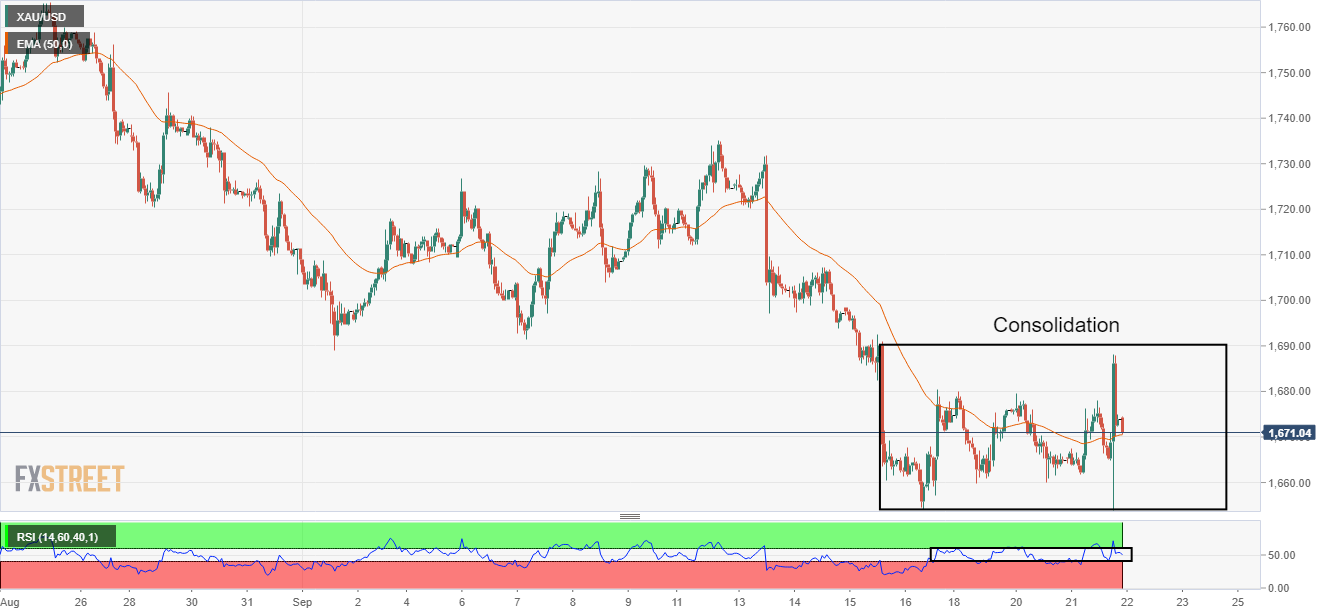
Gold price is oscillating in a tad wider range of $1,654.00-1,690.50 on an hourly scale. The precious metal is expected to display a lackluster performance until the volatility indicators get cooled-off. The 50-period Exponential Moving Average (EMA) is overlapping with the asset price, which signals a consolidation ahead.
Also, the Relative Strength Index (RSI) (14) has shifted back into the 40.00-60.00, which seeks further trigger for a decisive move.
Gold hourly chart