- GBP/JPY Price Analysis: Pares some of its weekly losses, fluctuates around 156.60
Market news
GBP/JPY Price Analysis: Pares some of its weekly losses, fluctuates around 156.60
- GBP/JPY recovered some ground on Wednesday and trimmed most of its weekly losses.
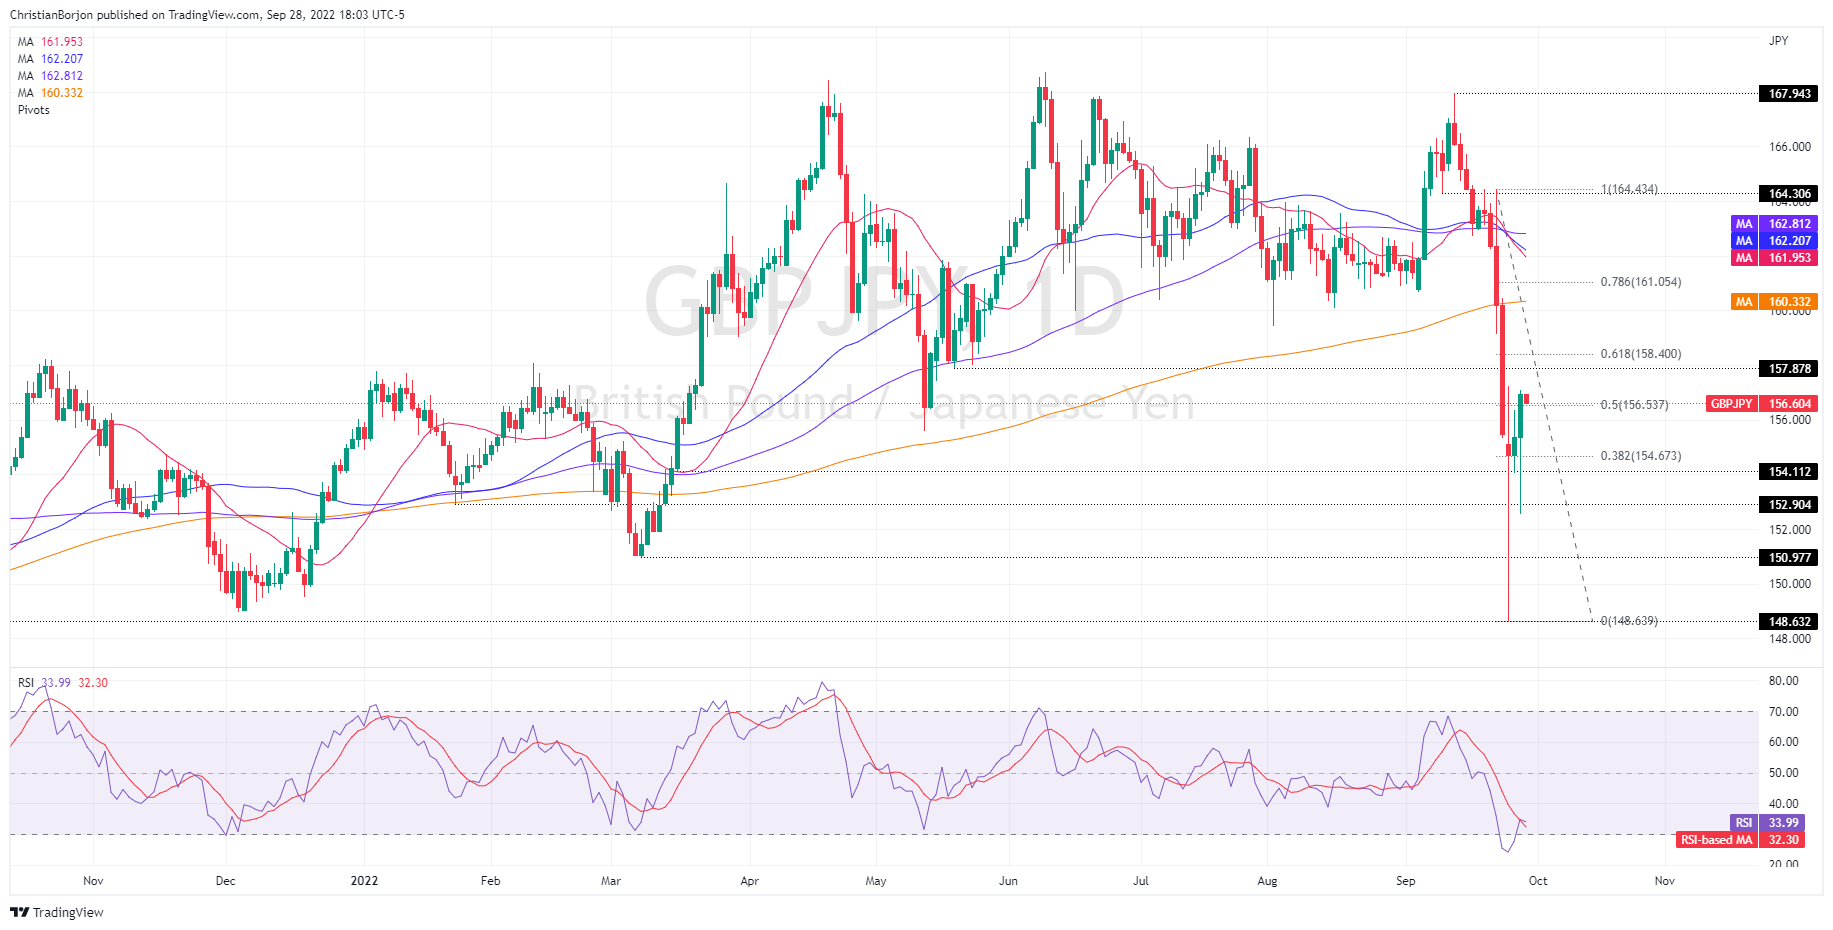
- However, if the GBP/JPY fails to reclaim 157.00, that would pave the way for sellers, and the pair could drop towards the 38.2% Fibonacci retracement at 154.67.
- A break above 157.00 might open the door for a rally towards the 61.8% Fibonacci at 158.40.
On Wednesday, the GBP/JPY finished the day with solid gains of 1%, as the Bank of England intervention bolstered UK bonds and alleviated the markets. However, as the Asian Pacific session takes over, the GBP/JPY is trading at 156.59, down 0.21%.
GBP/JPY Price Analysis: Technical outlook
The GBP/JPY daily chart portrays the pair as downward biases, as mentioned yesterday, “once it cleared the 200-EMA.” GBP/JPY’s Wednesday price action registered a daily high at 157.09, above the 50% Fibonacci retracement, drawn from the high/low of September 22 and 26, respectively, paving the way for a move towards the 61.8% retracement at 158.40. If the GBP/JPY breaks 158.00, then a move to the latter is on the cards, followed by the figure at 160.00, ahead of the 200-day EMA at 160-33
Otherwise, the GBP/JPY might be headed downwards, aligned with its current bias. Therefore, the GBP/JPY’s first support will be the 50% Fibonacci retracement at 156.53. Once cleared, the next support would be the 38.2% Fibonacci at 154.67, followed by the September 27 daily low at 154.07. A breach of the latter might send the GBP/JPY towards the January 24 daily low of 152.90.
GBP/JPY Key Technical Levels