- GBP/USD Price Analysis: Hovers around 1.1130s, after testing 1.1200
Market news
GBP/USD Price Analysis: Hovers around 1.1130s, after testing 1.1200
- During the week, the British pound has recovered 3.84% from the last week’s loss.
- The GBP/USD failure to clear 1.1200 sent the pair sliding toward current exchange rate levels.
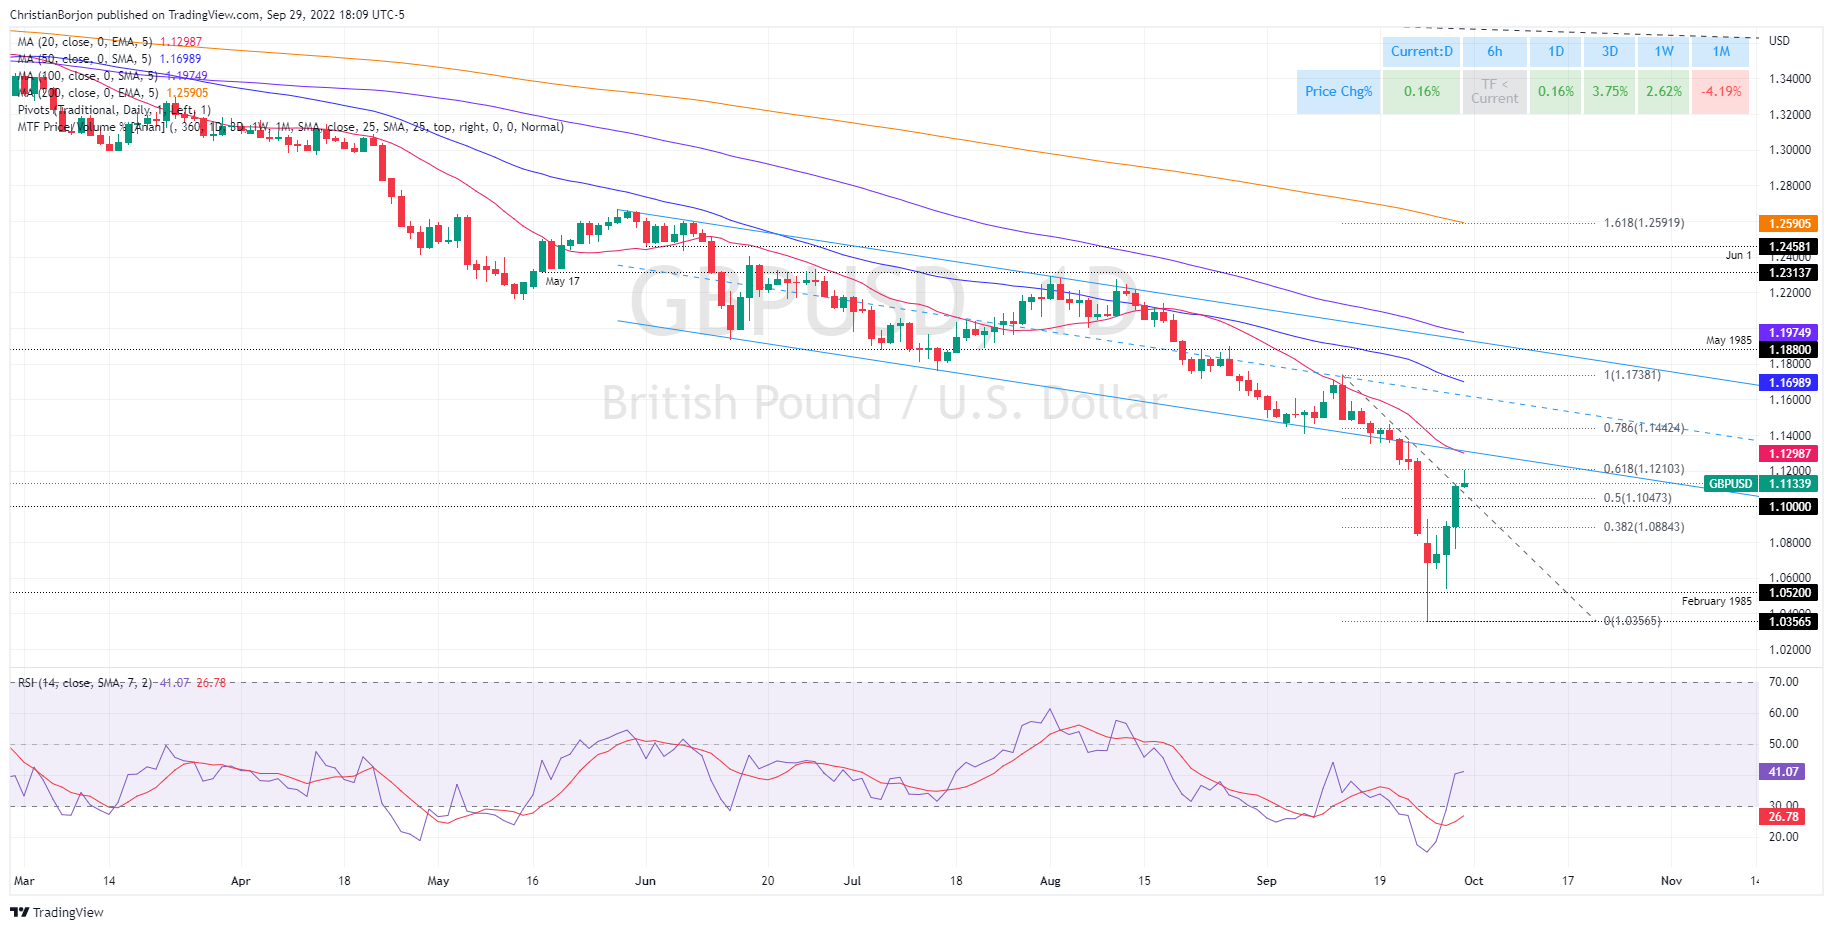
- If it clears the 1.1050, it could pave the way towards the 38.2% Fibonacci retracement at around 1.0880s.
The GBP/USD rallies sharply, trimming some of the last week’s losses, closing to the 1.1200 figure after being at the brink of testing parity when the pound fell to its lowest at 1.0356. At the time of writing, the GBP/USD is trading at 1.1133, 0.25% above its opening price, as the Asian session begins.
GBP/USD Price Analysis: Technical outlook
From a daily chart perspective, the GBP/USD is downward biased, despite the astonishing recovery in the week. Due to last Friday’s 600 pip volatile session, a mean reversion move was expected. The Relative Strength Index (RSI), exited from oversold conditions at 41.59 but shifted almost horizontally, meaning buyers’ momentum is dissipating.
Given the previously mentioned scenario and the GBP/USD failure to clear the 61.8% Fibonacci retracement at 1.1210, a fall towards 1.1050, the 50% Fibonacci level, drawn from the high/low of 1.1738/1.0356, is on the cards.
Therefore, the GBP/USD first support would be the 1.1100 mark. Once cleared, the next support would be the 50% Fibonacci retracement at 1.1050, which, once hurdle, could pave the way for a re-test of the 38.2% Fibonacci retracement at 1.0884.
GBP/USD Key Technical Levels