- NZD/USD Price Analysis: Bulls eye a run beyond the 'HotW' and eye 0.58 the figure
Market news
NZD/USD Price Analysis: Bulls eye a run beyond the 'HotW' and eye 0.58 the figure
- NZD/USD is breaking towards the 'High of the Week' (HotW) around 0.5755.
- The hourly W-formation is a reversion pattern and a peak formation within the head and shoulders on the 4-hour time frame.
- NZD/USD remains bullish while being supported by a rising trendline.
NZD/USD is breaking fresh highs for the week as we approach the Tokyo open. The price has rallied to a session high of 0.5750 so far in a firm push through key technical resistance and the bulls will be liming up for a retest of the structure as support for an optimal entry in order to target higher levels yet. The following is an analysis of the daily and 4-hour charts, concluded on the hourly in order to pinpoint where the opportunities could be for traders in the day ahead.
NZD/USD daily chart
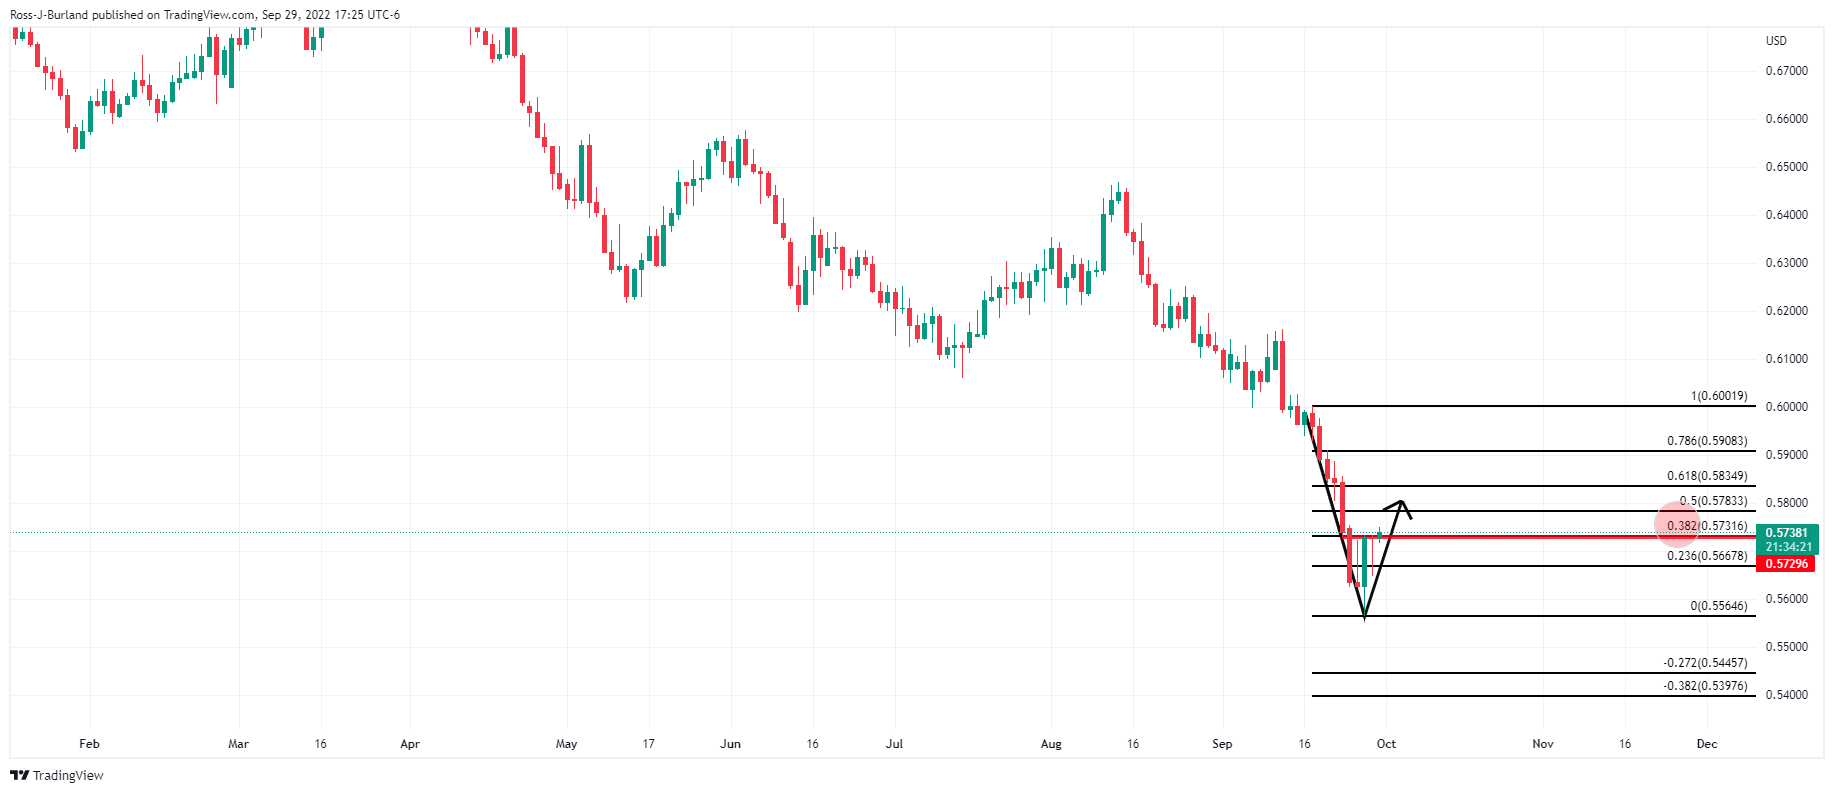
The daily chart has run into the 38.2% Fibonacci resistance which is currently being broken at the time of writing. This leaves prospects of a strong correction towards the next layer of key structure near a 62% ratio as follows:
NZD/USD H4 chart

The bird is breaking through the neckline of an inverse head and shoulders which is bullish in itself. This is on the back of a correction to a 61.8% Fibo adding additional conviction to the upside bias. The bulls can have their sights set on 0.58 the figure/ A break of 0.5830 will open risk to 0.5850.
NZD/USD H1 chart
Drilling down to an hourly perspective, this is where bulls will be looking for a discount:

The W-formation is a reversion pattern and a peak formation within the head and shoulders on the 4-hour time frame, supported by a rising trendline. Should the trendline hold tests near a 50% mean reversion, this could attract a spur of demand from the bulls. However, that depends on the high of the week holding initial tests neat 0.5755. The bias will remain to the upside so long as the 0.5680s structure holds up.