- Gold Price Forecast: XAU/USD sees a correction amid stiff hurdles around $1,700, US NFP buzz
Market news
Gold Price Forecast: XAU/USD sees a correction amid stiff hurdles around $1,700, US NFP buzz
- Gold price is expected to correct to near $1,690.00 as exhaustion meets the $1,700.00 resistance.
- Poor reading for the US Manufacturing PMI gamut has strengthened the gold bulls.
- US NFP is likely to drop as corporate has ditched the recruitment process.
Gold price (XAU/USD) is displaying signs of exhaustion while attempting to establish above the psychological hurdle of $1,700.00. The precious metal is expected to witness a correction as hurdles around $1,700.00 are quite strong and demands aggressive buying interest to get demolished. The yellow metal is likely to correct to near $1,690.00 but that doesn’t warrant a bearish reversal.
It is worth noting that the poor US ISM Manufacturing PMI readings for August month have strengthened the gold prices and investors are now shifting their focus toward the US Nonfarm Payrolls (NFP) data. According to the projections, the US economy created 250k jobs in September, lower than the August reading of 315k.
The US economy has been maintaining full employment levels, therefore, space for generating more employment is extremely less. Adding to that, the escalating Federal Reserve (Fed)’s interest rates are also restricting the corporate to continue their hiring programs with sheer pace. The US employment generation capacity could deteriorate further as corporate has ditched the recruitment process for a while.
Gold technical analysis
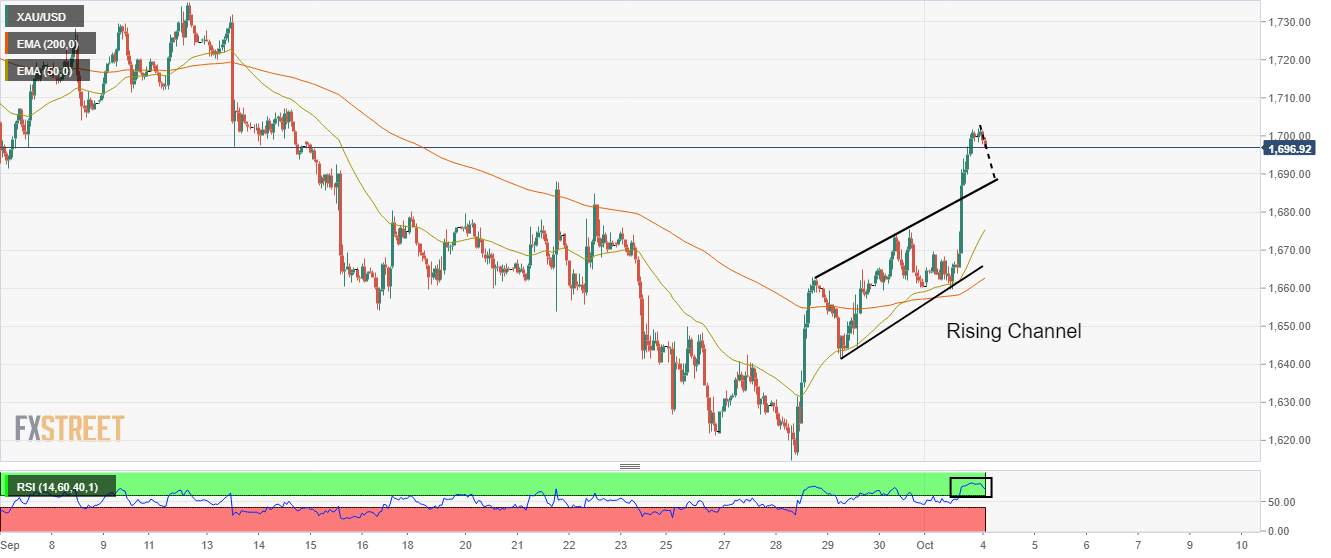
Gold prices have witnessed a juggernaut rally after an upside break of the Rising Channel chart pattern on an hourly scale. An upside break of the above-mentioned chart pattern plotted from Wednesday’s high at $1,662.80 and Thursday’s low at $1,641.59 displays the sheer confidence of bulls. Exhaustion at elevated levels is indicating a correction to near $1,690.00.
A formation of a golden cross, represented by the 50-and 200-period Exponential Moving Averages (EMAs) at $1,656.50 is indicating more upside ahead.
Also, the Relative Strength Index (RSI) (14) is oscillating in a bullish range of 60.00-80.00, which advocates the continuation of upside momentum.
Gold hourly chart