- USD/CAD Price Analysis: Inverted head-and-shoulders in the hourly chart targets 1.3877
Market news
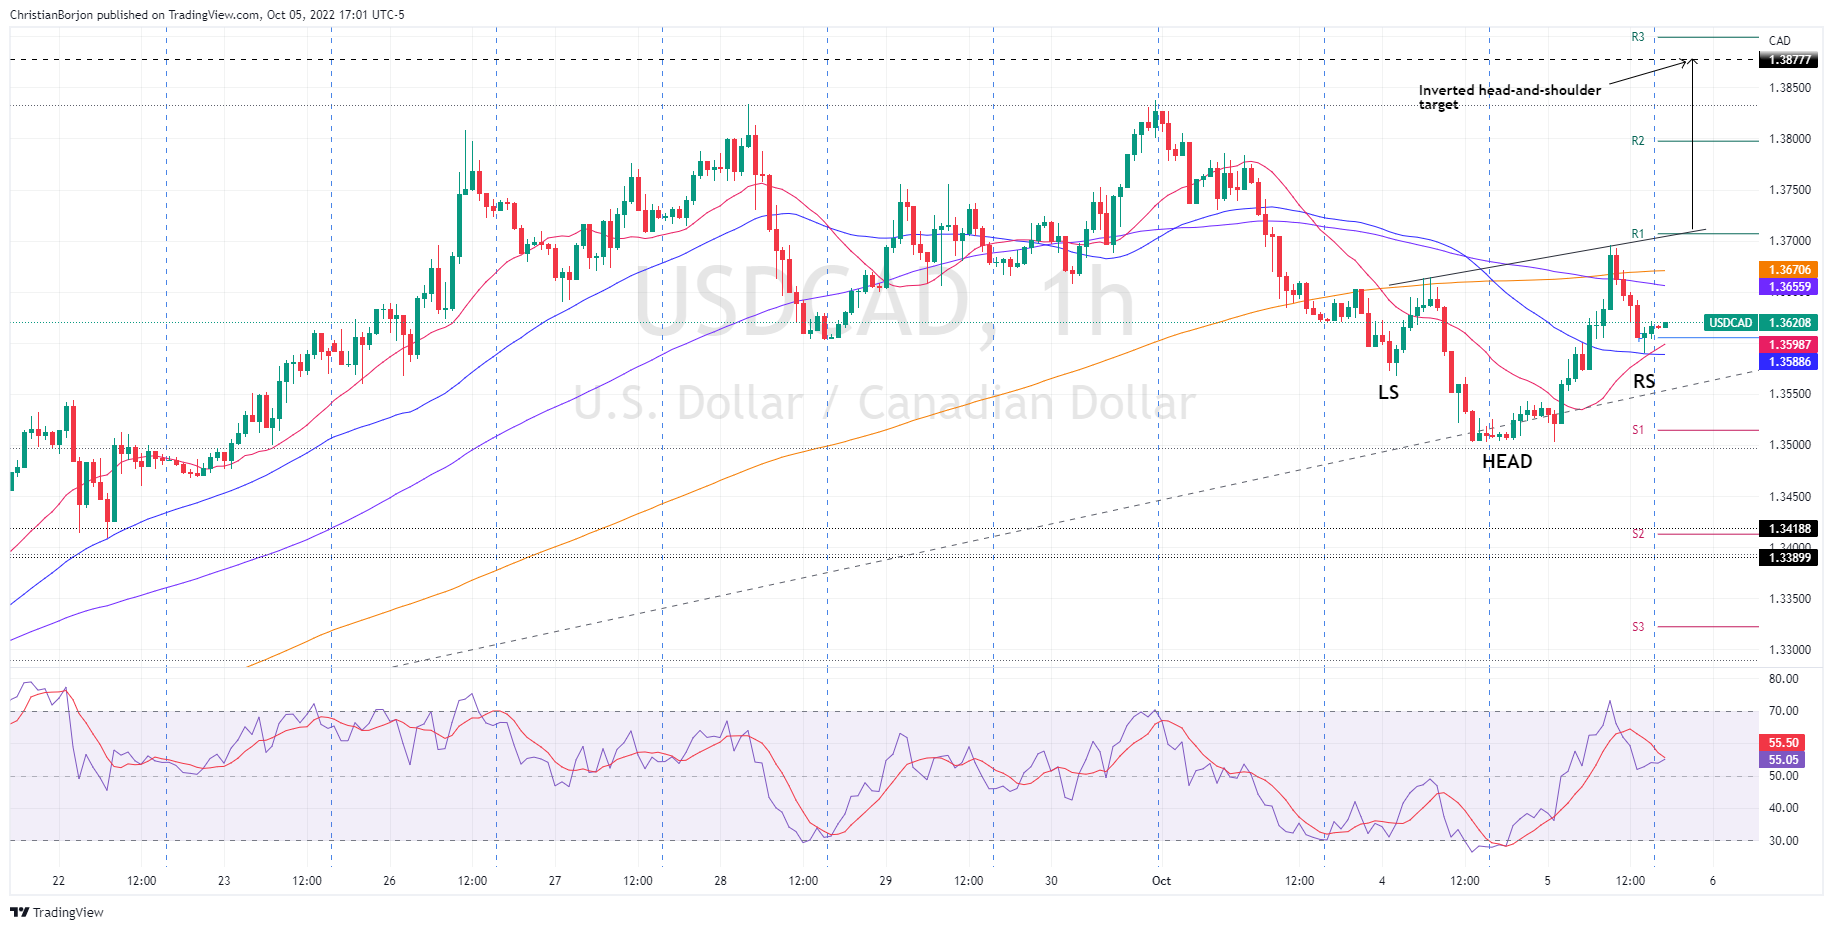
USD/CAD Price Analysis: Inverted head-and-shoulders in the hourly chart targets 1.3877
- USD/CAD found support around 1.3500, some pips above the 20-day EMA.
- In the short term, the USD/CAD one-hour chart formed an inverse head-and-shoulders, which targets the pair to hit 1.3877.
The USD/CAD cuts two days of losses and rises almost 0.80% as the New York session winds down due to some factors. Firstly, market sentiment deteriorated as traders assessed that a Fed “dovish” pivot was nowhere near to happening, so the greenback recovered against most G8 currencies. Therefore, the USD/CAD is trading at 1.3620, above its opening price.
USD/CAD Price Analysis: Technical outlook
The USD/CAD faced solid support at 1.3500, the 38.2% Fibonacci retracement, 50-pips above the 20-day EMA, after plunging from the YTD high above 1.3800. Traders should be aware that price action in the last couple of days formed a tweezers-bottom, meaning that prices would likely increase. However, after dropping from oversold levels, RSI’s flat slope suggests the pair might consolidate before determining its direction.
The USD/CAD one-hour chart portrays the pair as forming an inverted head-and-shoulders chart pattern, though to validate it, the major needs to clear the neckline at around the R1 daily pivot at 1.3707. Once broken, the next resistance would be the R2 pivot at 1.3797, followed by the inverted head-and-shoulders chart pattern target at 1.3877.
USD/CAD Key Technical Levels