- AUD/JPY Price Analysis: Sellers target the 200-day EMA as a bearish flag emerges
Market news
AUD/JPY Price Analysis: Sellers target the 200-day EMA as a bearish flag emerges
- The AUD/JPY is set to finish the week positive, up by 0.43%.
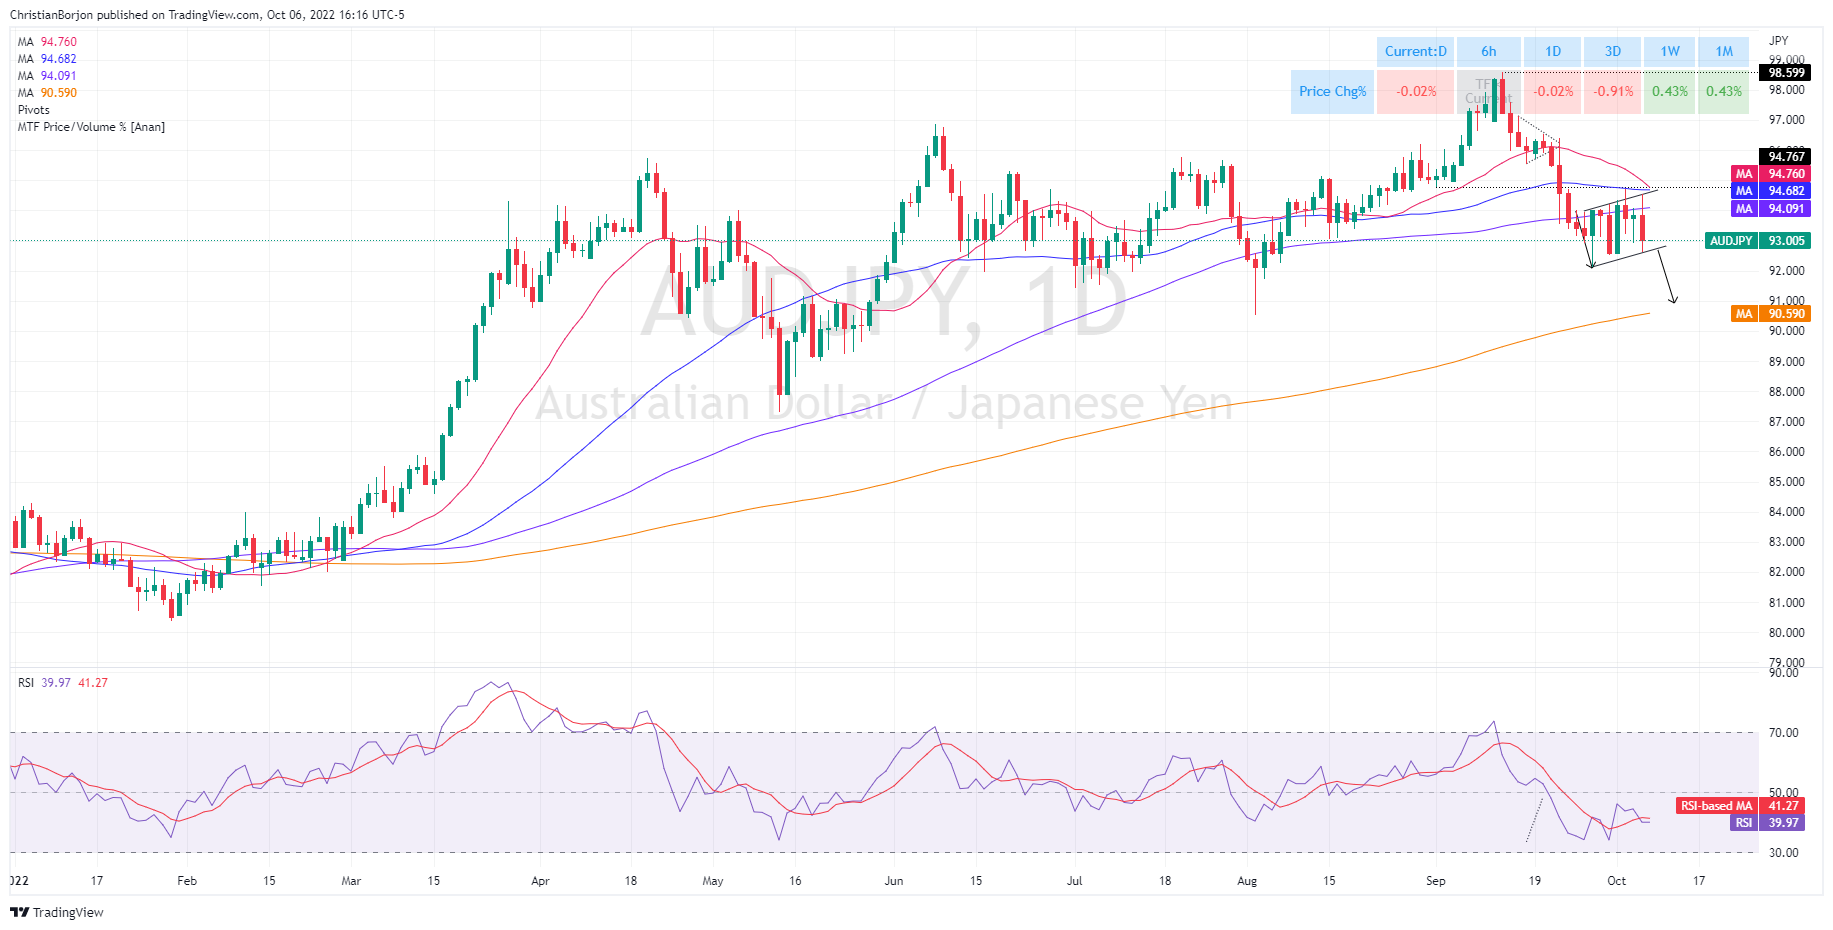
- A bearish flag emerged in the daily chart perspective, which targets a fall toward the 200-day EMA at 90.58
As the Asian Pacific session begins, the AUD/JPY is almost flat during the day, following Thursday’s 0.87% fall, due to risk-off impulse, as shown by US equities falling between 0.68% and 1.15%. Factors like mixed US economic data reported during the week, and market speculations of a Fed dovish pivot waning, bolstered safe-haven assets, like the US dollar and the Japanese yen. At the time of writing, the AUD/JPY is trading at 93.00, almost flat.
AUD/JPY Price Forecast
The AUD/JPY daily chart shows the pair consolidates around the 93.00-94.60 range, forming a bearish flag. Notably, the AUD/JPY has faced solid resistance around 94.00/60, around the top-trend line of the bearish flag.
Since Wednesday, the AUD/JPY traded, near the bottom of the bearish flag, though on Thursday, rallied towards the top and retraced those earlier gains. Therefore, the AUD/JPY path of least resistance is downward biased, further confirmed by the Relative Strength Index (RSI), staying in bearish territory, below its 7-day RSI’s SMA.
Therefore, the AUD/JPY first support would be the bearish flag bottom trendline around 92.50-75. A breach of the latter will expose the September 28 cycle low at 92.12, immediately followed by the 92.00 figure. Once cleared, the AUD/JPY might slide towards the 200-day EMA at 90.58.
AUD/JPY Additional Technical Levels