- Gold Price Forecast: XAU/USD sees a downside below $1,660 amid firmer DXY, US Inflation eyed
Market news
Gold Price Forecast: XAU/USD sees a downside below $1,660 amid firmer DXY, US Inflation eyed
- Gold price has turned sideways after a sheer downside below $1,670.00 amid a risk-off market mood.
- Intensified missile attacks by Russia on Kyiv have trimmed the risk appetite of investors.
- This week, the US inflation data will be of utmost importance.
Gold price (XAU/USD) is displaying topsy-turvy moves below $1,670.00 in early Asia. The precious metal is expected to display sheer volatility if it ditches the cushion of $1,660.00 as the risk-off profile is intensifying amid aggressive attacks on Ukraine by Russia. After damaging the Crimean bridge in Russia that is acting as a supply line for Russian troops in southern Ukraine, Russia has intensified missile attacks in Kyiv.
Meanwhile, the US dollar index (DXY) has been strengthened on the dismal market mood and has established comfortably above the round-level hurdle of 113.00. US markets were closed on Monday but S&P500 futures have remained majorly rough amid negative market sentiment.
This week, the mega event of the US inflation data will provide lucid guidance for further direction. A decline in gasoline prices has resulted in a trimmed consensus for the headline US inflation data. The economic data is seen lower at 8.1%. While the core inflation that excludes oil and food prices is seen higher at 6.5%.
As per CME Fedwatch tool, more than 78% odds are favoring that the Federal Reserve (Fed) will announce a fourth consecutive 75 basis points (bps) rate hike.
Gold technical analysis
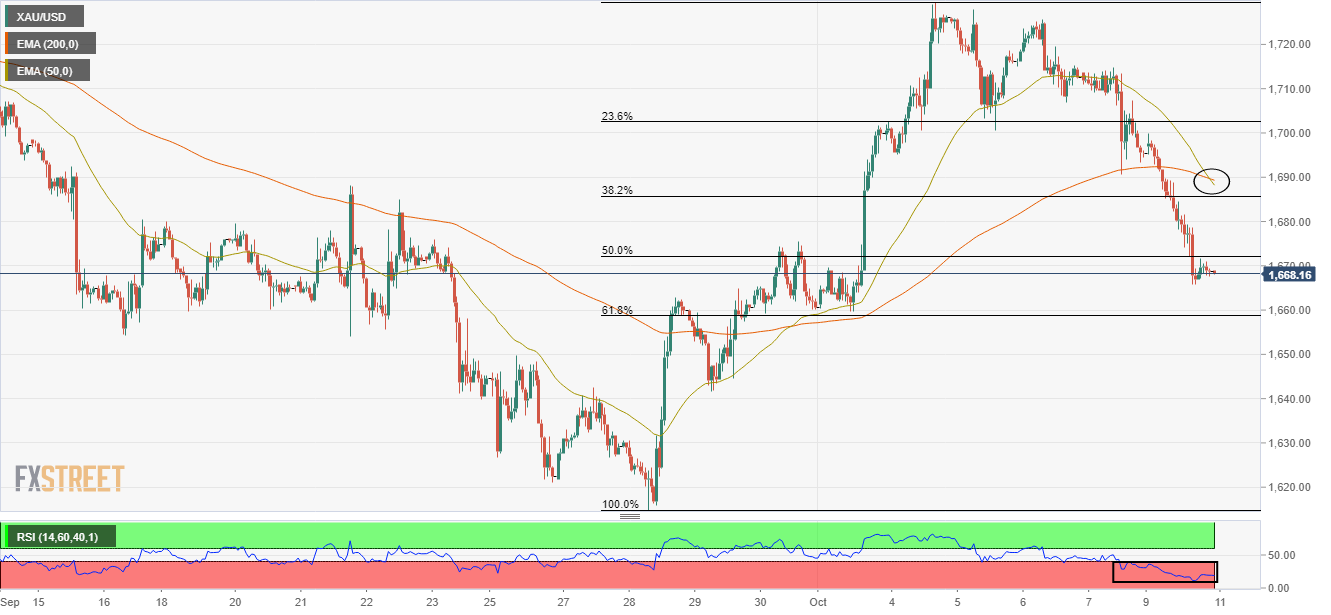
On an hourly scale, the gold prices have established below the 50% Fibonacci retracement placed at $1,672.61 and are declining towards the 61.8% Fibo retracement at $1,658.90. The 50-and 200-period Exponential Moving Averages (EMAs) have delivered a death cross at around $1,690.00, which adds to the downside filters.
Adding to that, the Relative Strength Index (RSI) (14) has shifted into the bearish range of 20.00-40.00, which indicates more weakness ahead.
Gold hourly chart