- USD/CNH Price Analysis: Pokes weekly hurdle above 7.1700 during five-day uptrend
Market news
USD/CNH Price Analysis: Pokes weekly hurdle above 7.1700 during five-day uptrend
- USD/CNH takes the bids to refresh one-week high.
- Nearly overbought RSI, immediate resistance line test buyers cheering golden cross.
- Sellers need confirmation from 200-HMA to retake control.
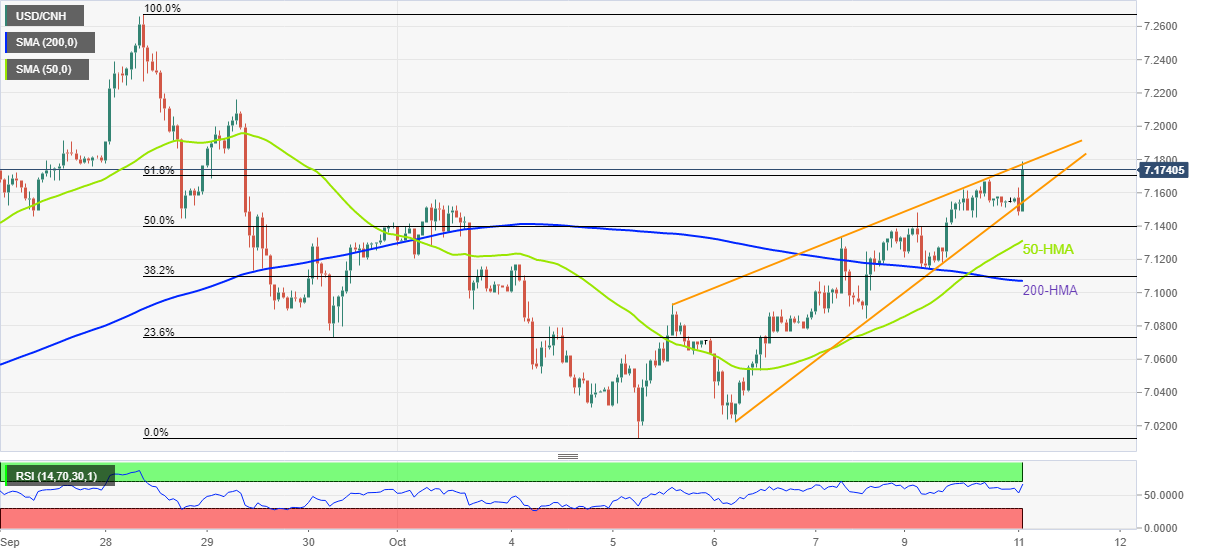
USD/CNH remains firmer for the fifth consecutive day, up 0.32% around 7.1760 during Tuesday’s Asian session. In doing so, the offshore China yuan (CNH) pair stays firmer past the 61.8% Fibonacci retracement of September 28 to October 05 moves amid firmer RSI.
However, the resistance line of a weekly rising wedge bearish chart pattern challenges the USD/CNH bulls around 7.1775. On the same line could be the RSI line’s proximity to the overbought territory.
Even so, the golden cross of the 50-HMA over the 200-HMA joins the sustained break of the key Fibonacci retracement to keep the buyers hopeful of crossing the 7.1775 hurdle.
Following that, the September 29 swing high near 7.2160 and the record high flashed during the last month around 7.2675 will be in focus.
Alternatively, pullback moves need to conquer the stated wedge’s support line, close to 7.1545, to tease the sellers.
In that case, the 50-HMA and the 200-HMA, respectively near 7.1315 and 7.1070 in that order, will become decisive in probing the bears before giving them control.
USD/CNH: Hourly chart
Trend: Pullback expected