- USD/CHF Price Analysis: Solid above parity, eyeing 2019’s highs above 1.0100
Market news
USD/CHF Price Analysis: Solid above parity, eyeing 2019’s highs above 1.0100
- USD/CHF trades above parity for the second consecutive day, following the US CPI report.
- The major hit a fresh YTD high of 1.0074, though retraced to the current spot price.
- USD/CHF Price Forecast: The uptrend remains intact and could reach 2019 May and April highs; otherwise, it could dive below parity.
The USD/CHF oscillates around parity following Thursday’s volatile session, which witnessed the major hitting a YTD high of 1.0074 before retracing to current exchange rates, despite US inflation data, justifying further Fed tightening. At the time of writing, the USD/CHF is trading at 1.0009, above its opening price by 0.04%.
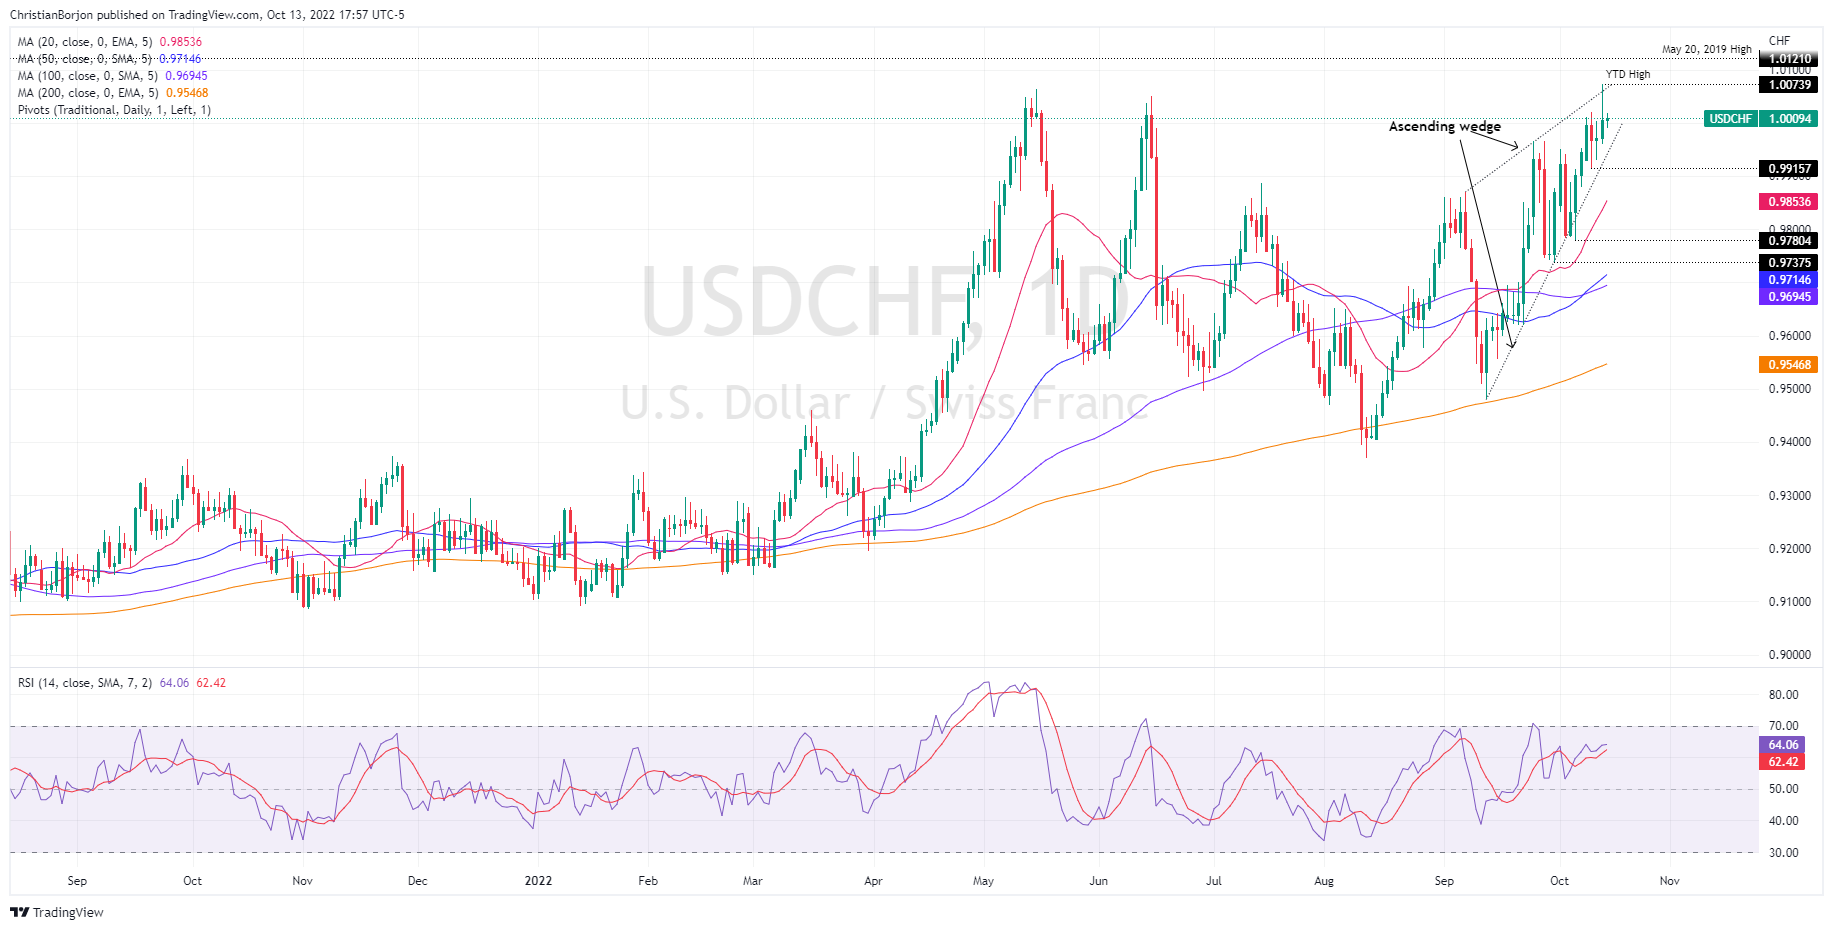
USD/CHF Price Forecast
The daily chart suggests the pair is upward biased, though price action since mid-September and through October formed an ascending wedge, which by the book, is a bearish pattern. However, it is worth noting that successive series of higher highs/lows suggests the uptrend is intact, but a break below the current week low of 0.9915 could open the door for further losses.
Therefore, support levels are 0.9853, the 20-day EMA, followed by October’s 6 0.9780 swing low, ahead of September’s low at 0.9737.
Contrarily, if the USD/CHF breaks above the YTD high at 1.0074, a test of 1.0100 is on the cards. Once cleared, the next resistance levels would be the high of May 20, 2019, at 1.0121, followed by April 26, 2019, high at 1.0230.
USD/CHF Key Technical Levels