- Gold Price Forecast: XAU/USD builds cushion around $1,650, hawkish Fed fears remain elevated
Market news
Gold Price Forecast: XAU/USD builds cushion around $1,650, hawkish Fed fears remain elevated
- Gold price has picked bids around the $1,650.00 support as DXY sees more pressure.
- Strong yields brought sheer weakness in the gold prices after a pullback.
- Upbeat US NFP is delighting the Fed to hike interest rates unhesitatingly.
Gold price (XAU/USD) is witnessing some buying interest around $1,650.00 despite soaring bets for bigger rate hikes by the Federal Reserve (Fed). On Monday, the precious metal eased the majority of the gains despite mayhem in the US dollar index (DXY). The DXY dropped to near the round-level cushion of 112.00 as the risk-on impulse gained significant traction. S&P500 advanced vertically and recovered Friday’s losses.
Soaring yields backed by advancing certainty of policy tightening by the Fed resulted in a steep fall in gold prices. The 10-year US Treasury yields sustain above 4%. A divergence in price action from the DXY and yields kept the gold prices in the bush of bears and risk-perceived currencies in the bullish trajectory.
Higher-than-projected Consumer Price Index (CPI), released last week, and September’s better-than-expected Nonfarm Payrolls (NFP) data are compelling the Fed to sound hawkish and continue the current pace of hiking interest rates.
Meanwhile, commentary from Societe Generale carries a bearish view on gold for a tad longer period. “In the past, we have observed that gold seems to correlate well with three factors – US real rates, the dollar, and ETF flows (regression r-squared of almost 95%). However, the price of gold has remained quite elevated compared to the theoretical value yielded by our models.”
“If real rates remain elevated for the foreseeable future, one of the assets that could come under pressure is gold.”
Gold technical analysis
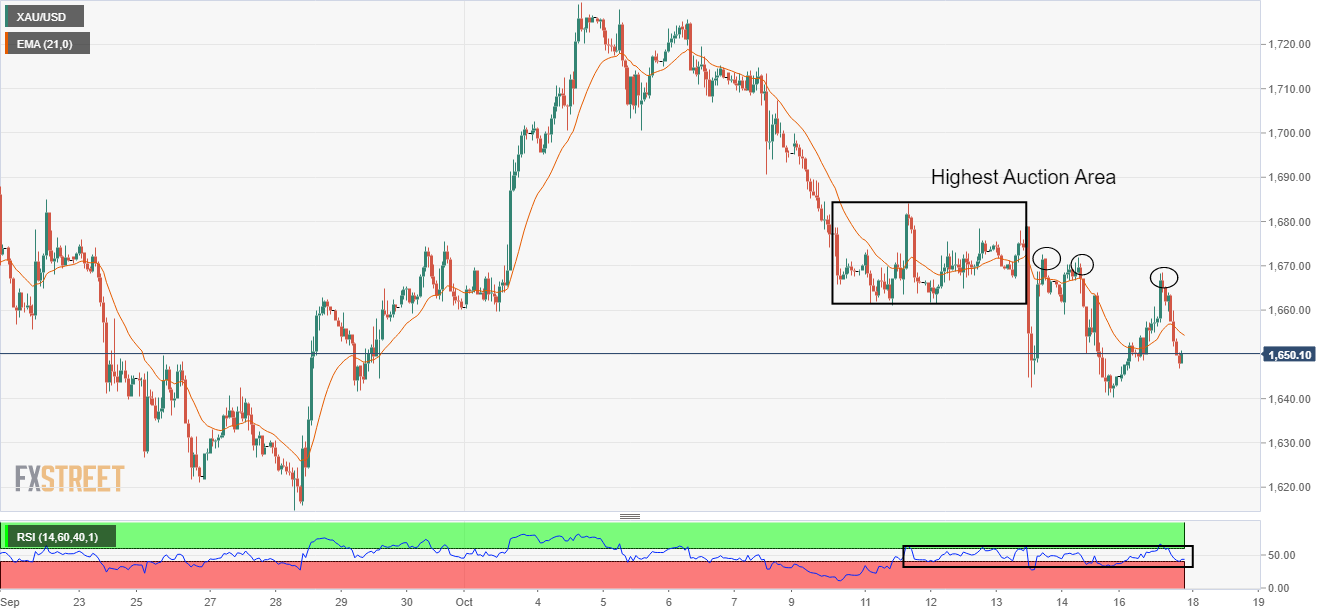
On an hourly scale, the gold prices have picked significant selling pressure in several attempts of surpassing the highest auction area placed in a range of $1,661.70-1,684.50. The precious metal has dropped below the 20-period Exponential Moving Average (EMA) at $1,654.43.
The Relative Strength Index (RSI) (14) is hovering around 40.00, and a drop below the same will trigger the downside momentum.
Gold hourly chart