- USD/CAD Price Analysis: Plotting the path of least resistance, down
Market news
USD/CAD Price Analysis: Plotting the path of least resistance, down
As per the prior analysis, USD/CAD Price Analysis: Bulls are lurking at key MTF support areas, where it was explained that the loonie firmed from a peak formation vs the greenback, we have seen a turnaround in the greenback and a move up in USD/CAD. However, the following scenario is a bearish thesis for the close this week ahead of the Federal Reserve next week.
USD/CAD prior analysis
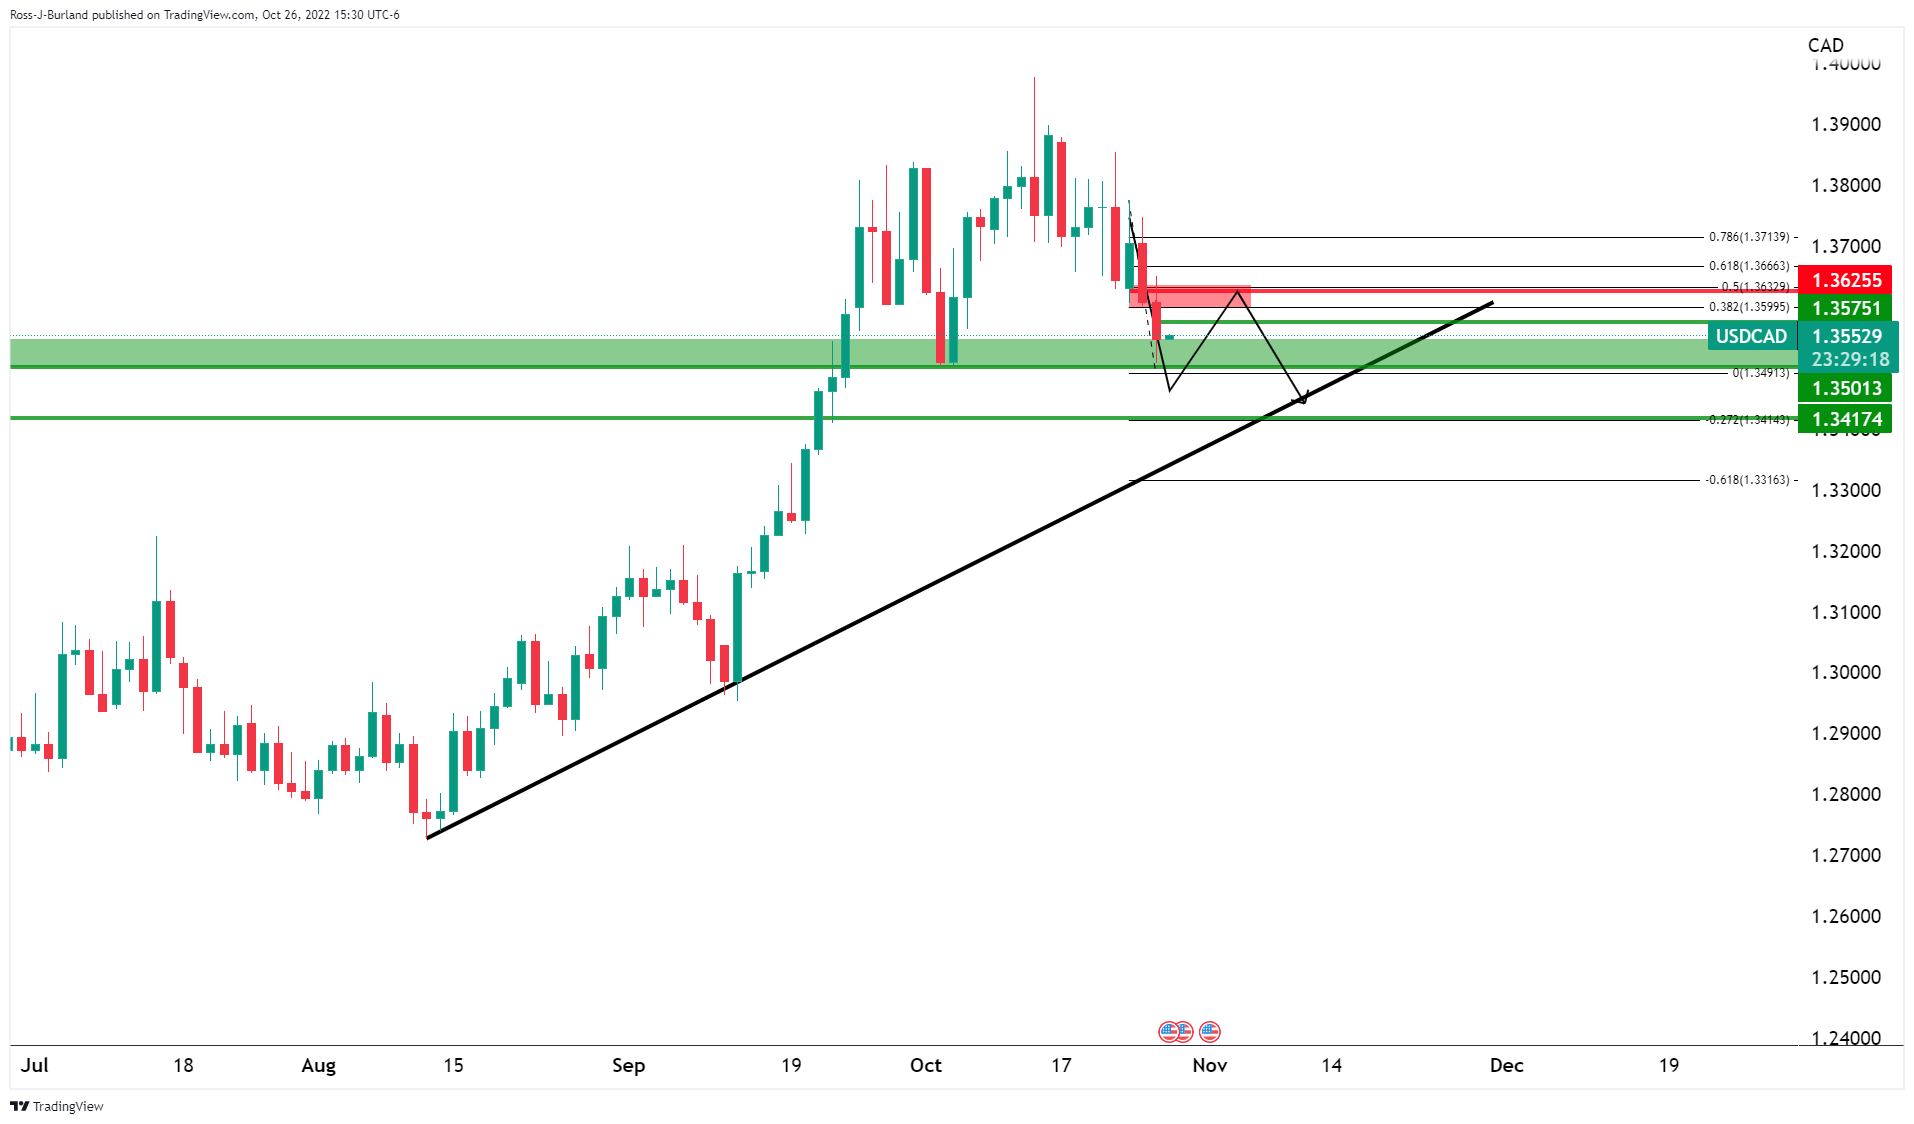
USD/CAD update
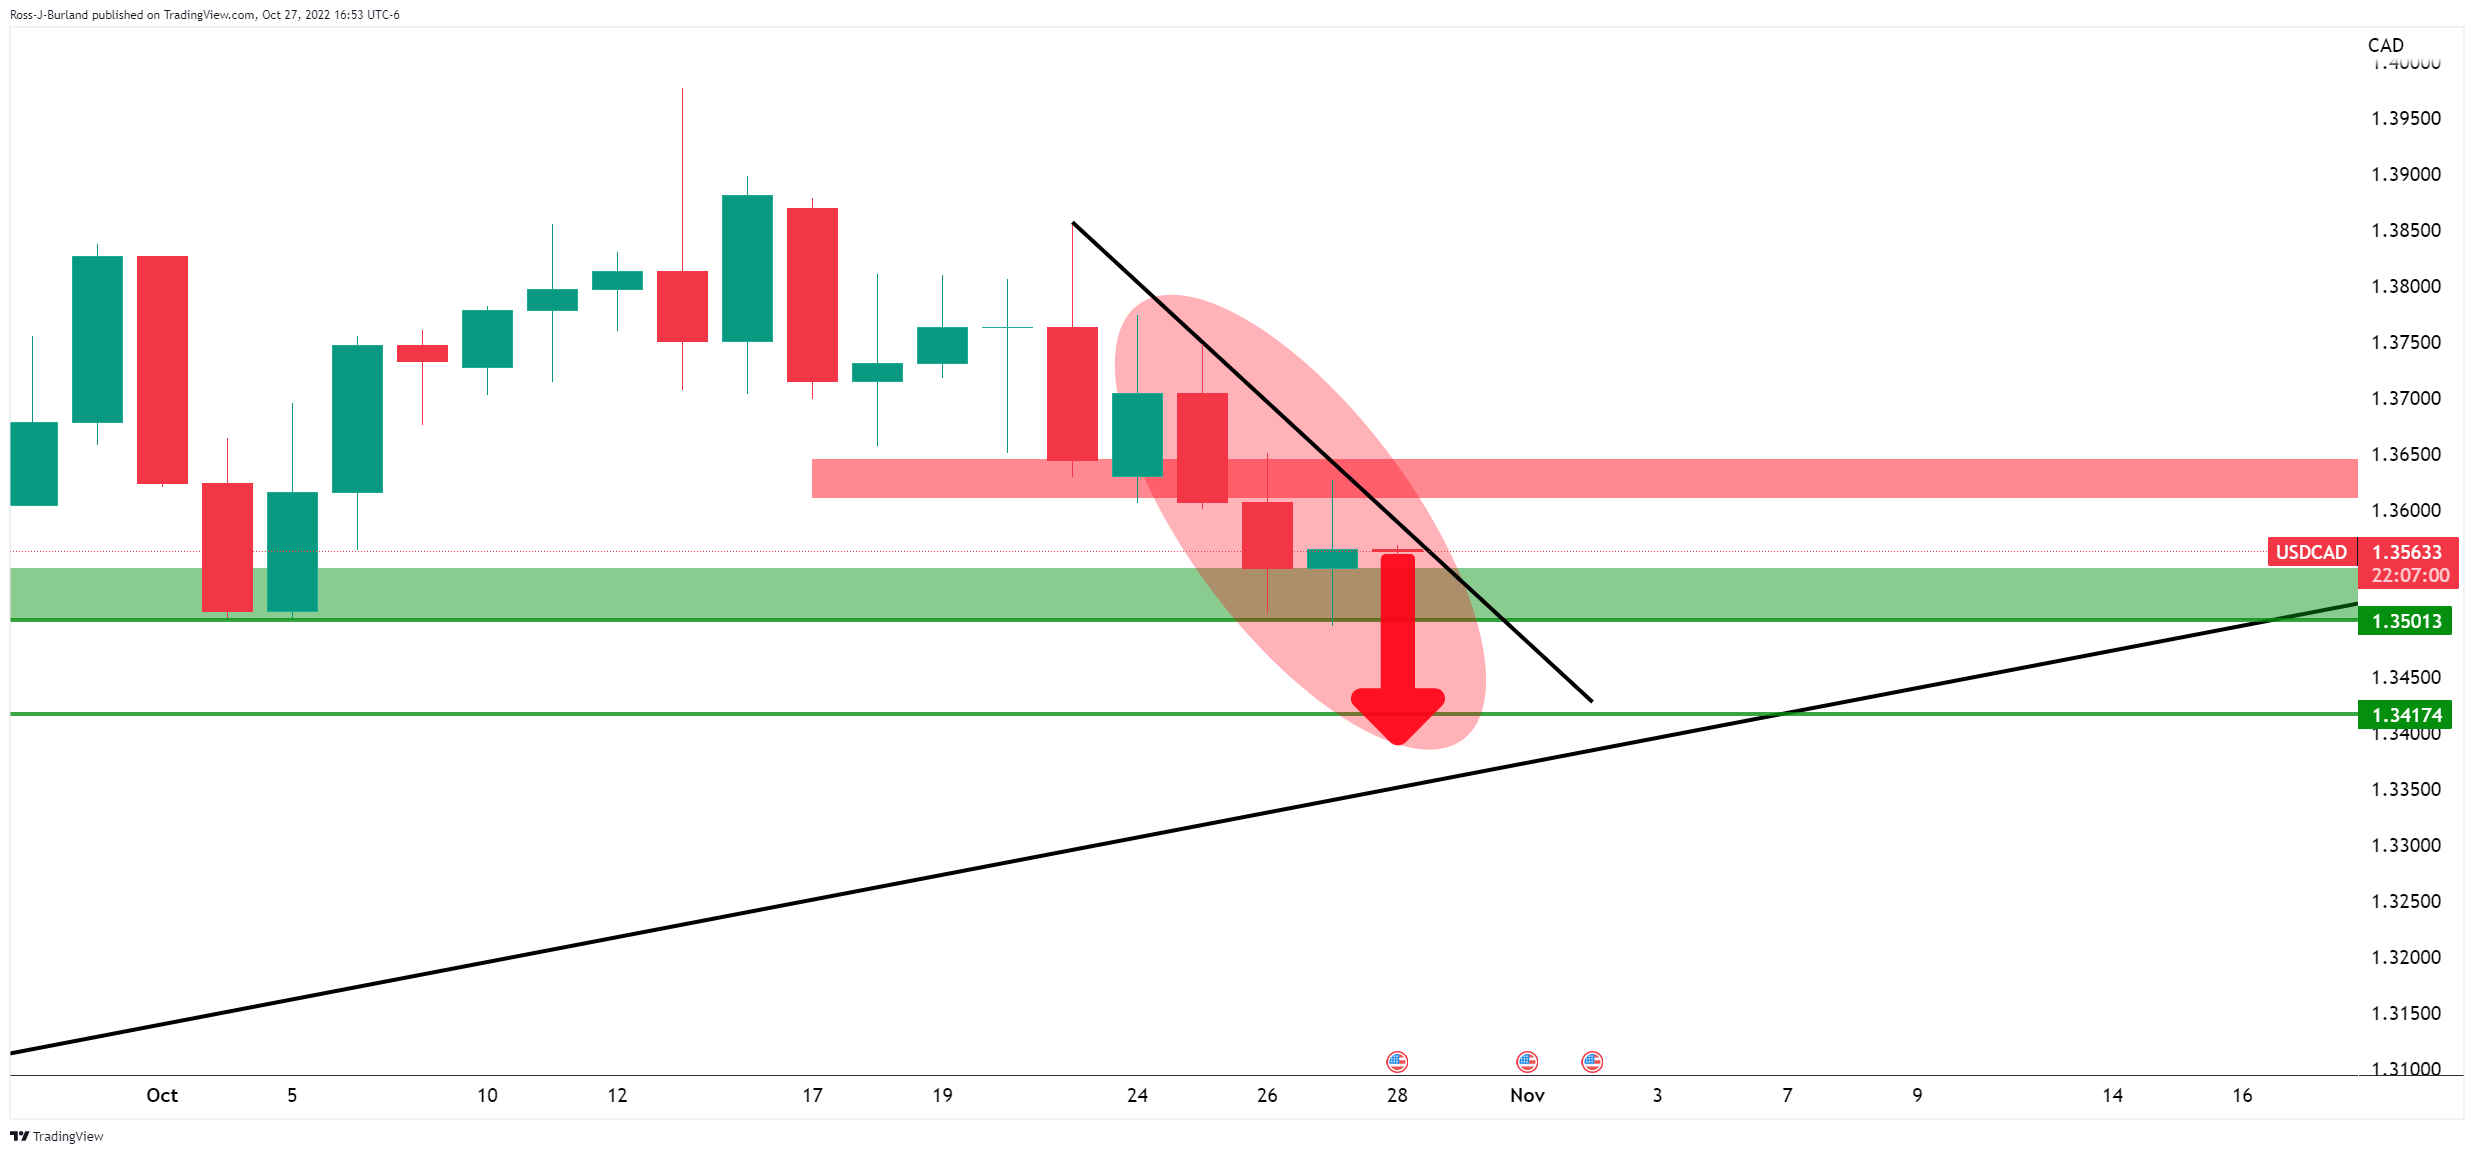
The price has indeed moved into the resistance, but where next?
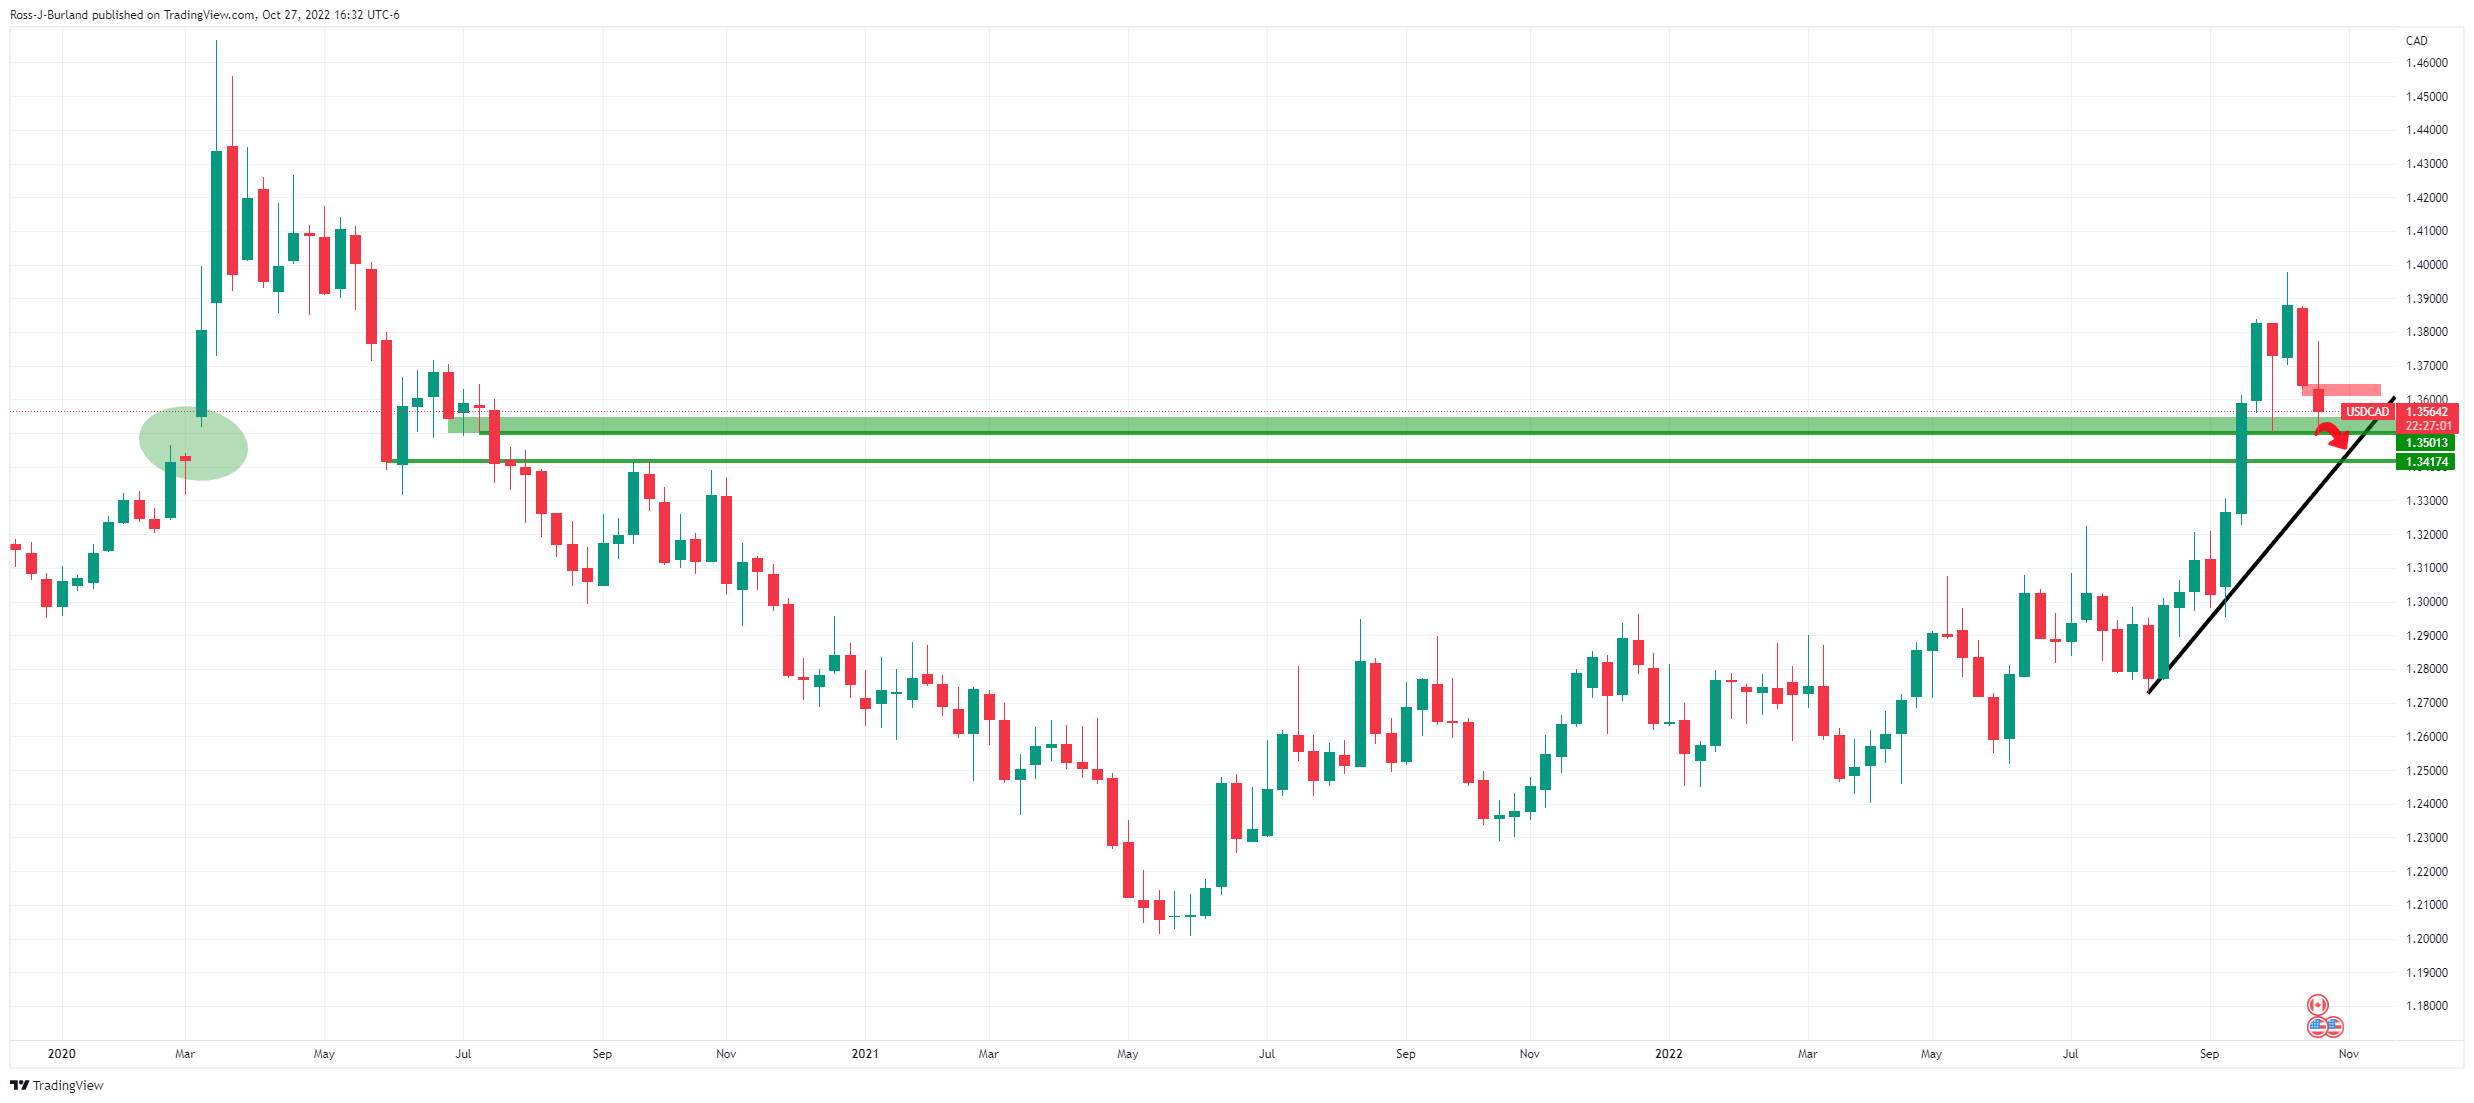
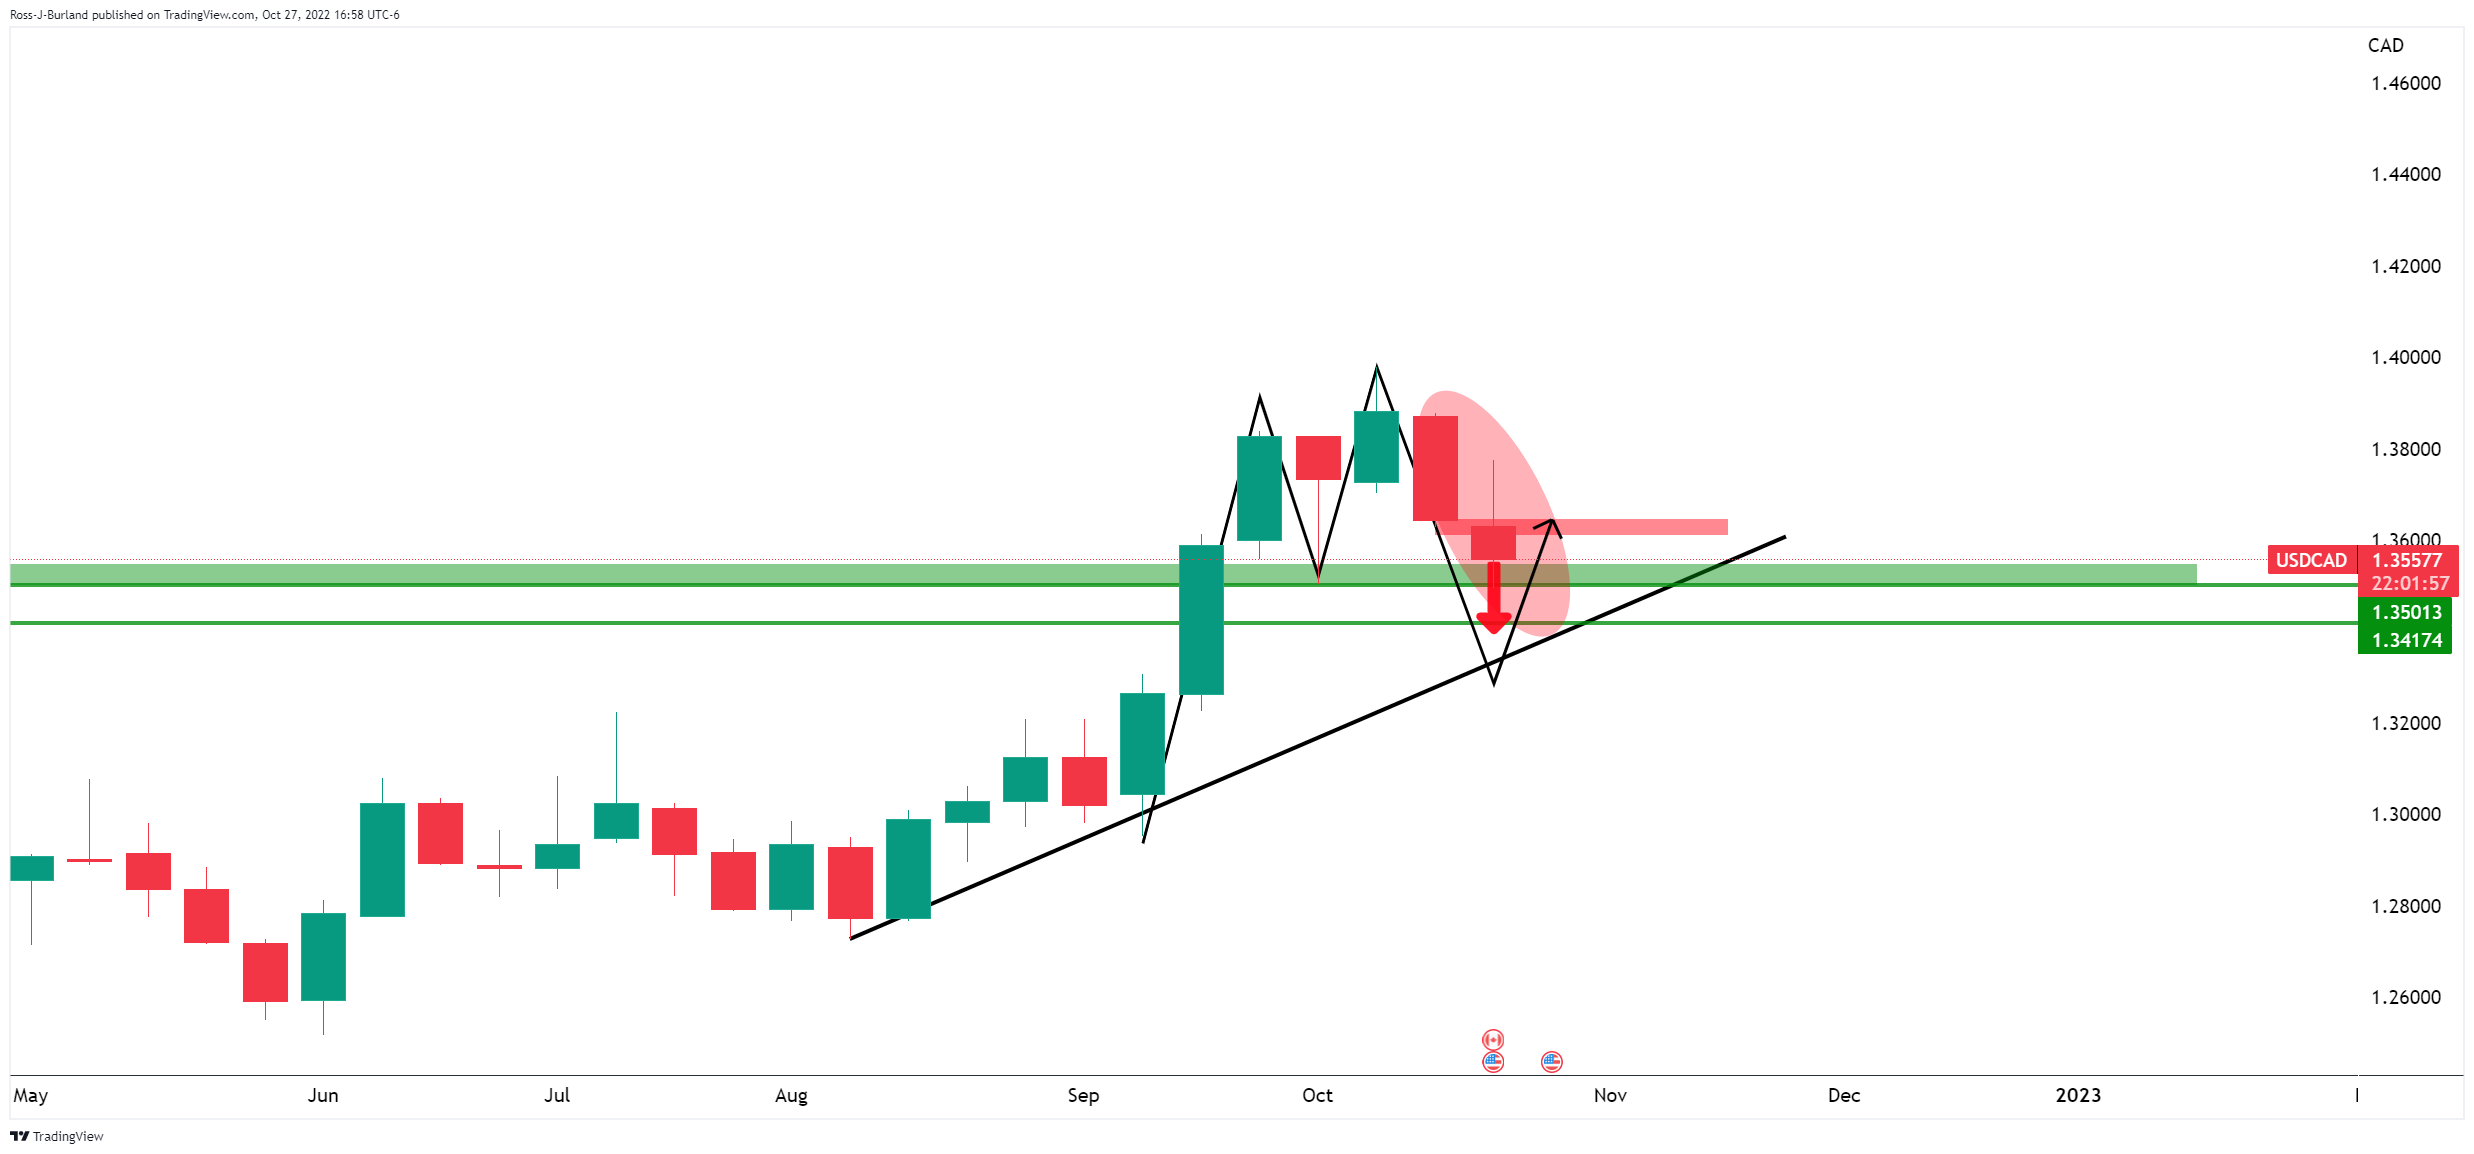
USD/CAD weekly chart
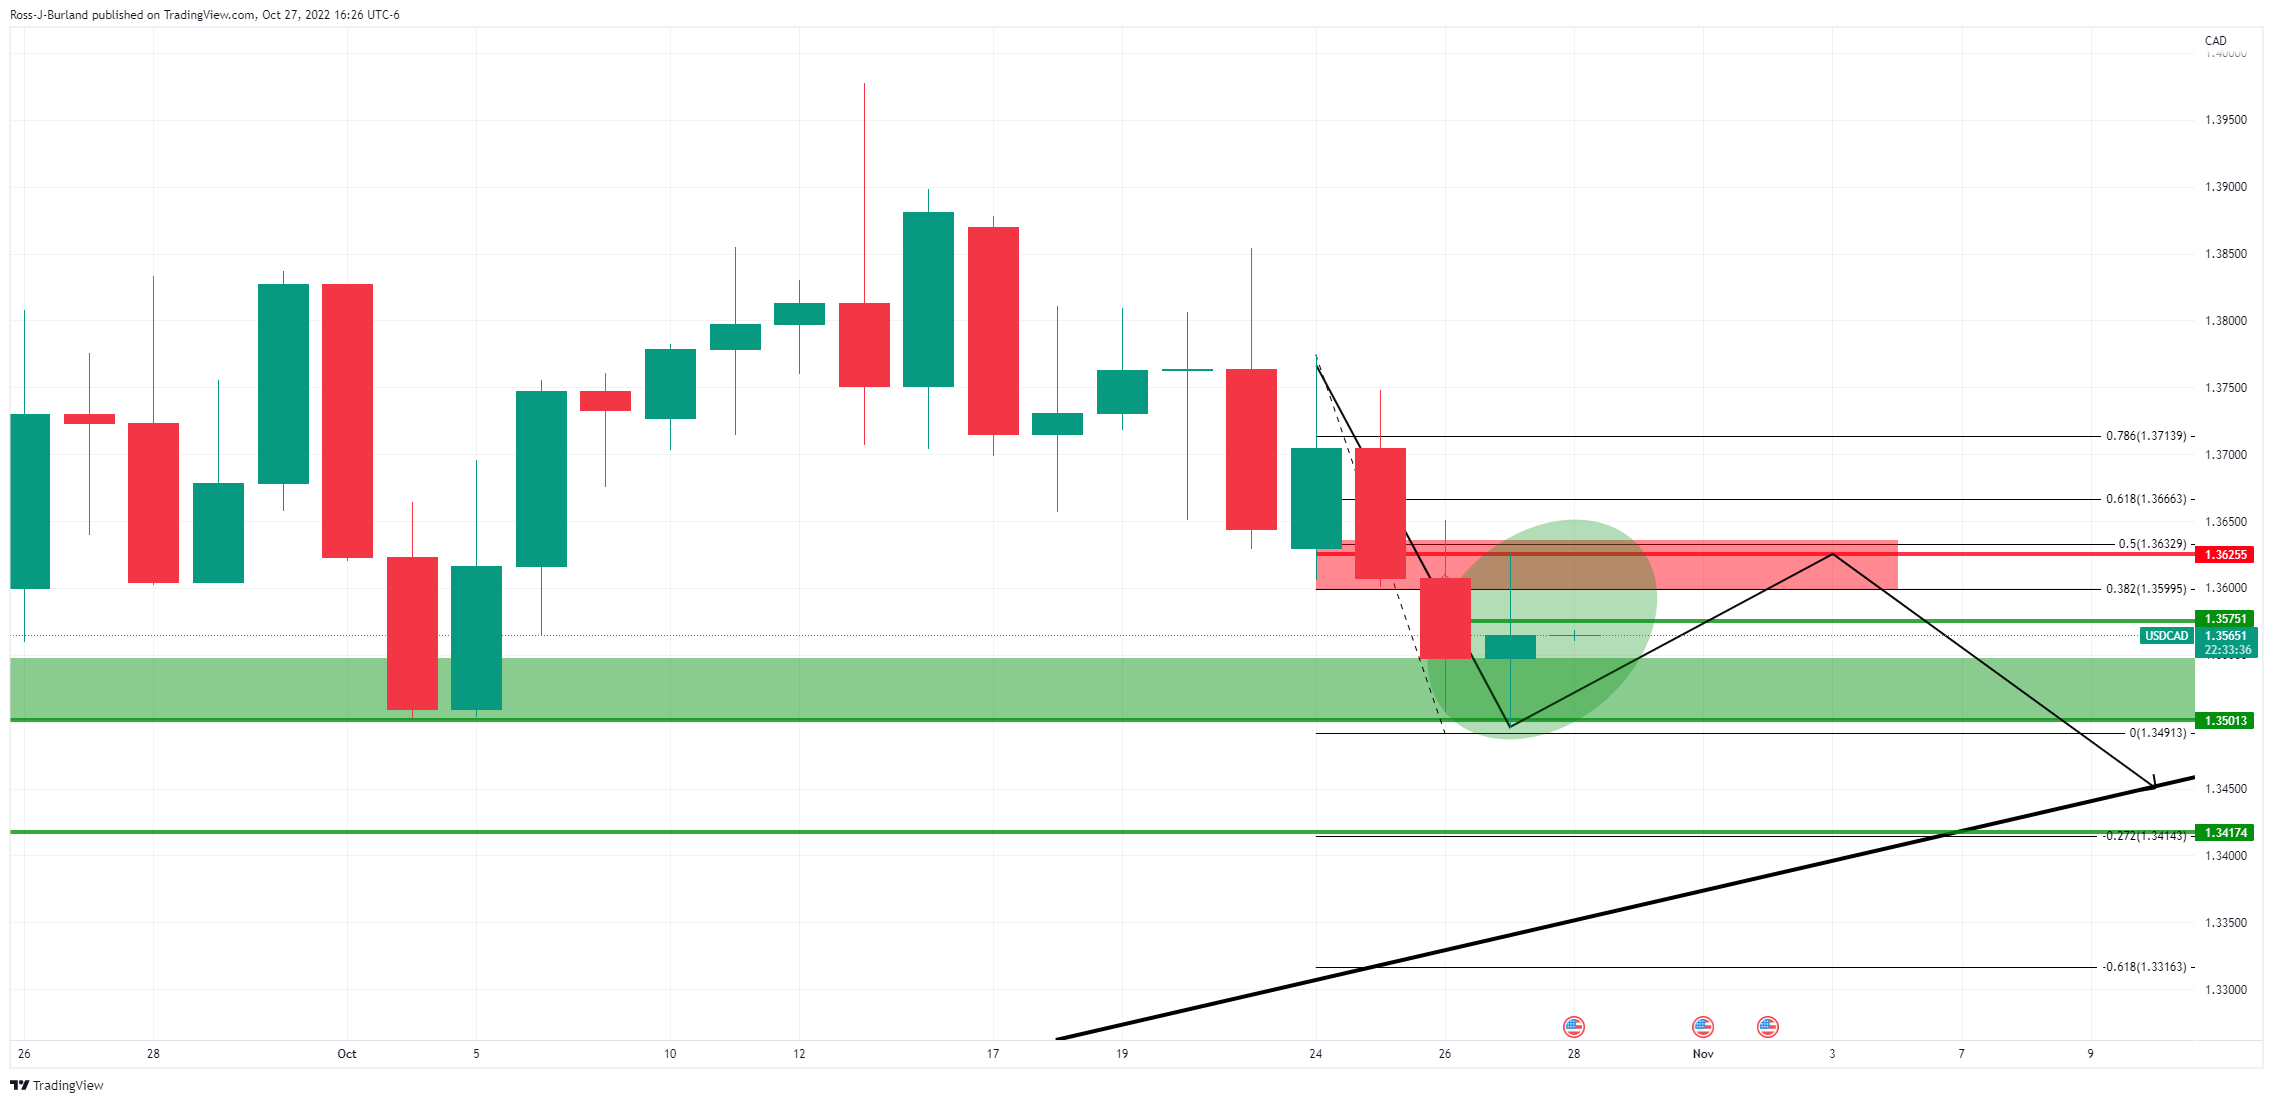
While the M-formation is a reversion pattern, there could still be a push into the trendline before the week is out:
USD/CAD outlook for the close
Given the length of shorts in the market and the less-than-convincing correction the prior day and considering the 140 pip daily ATR, there are prospects of a move towards 1.3420. After all, we are still on the front side of the trendline:
(Weekly M-formation)
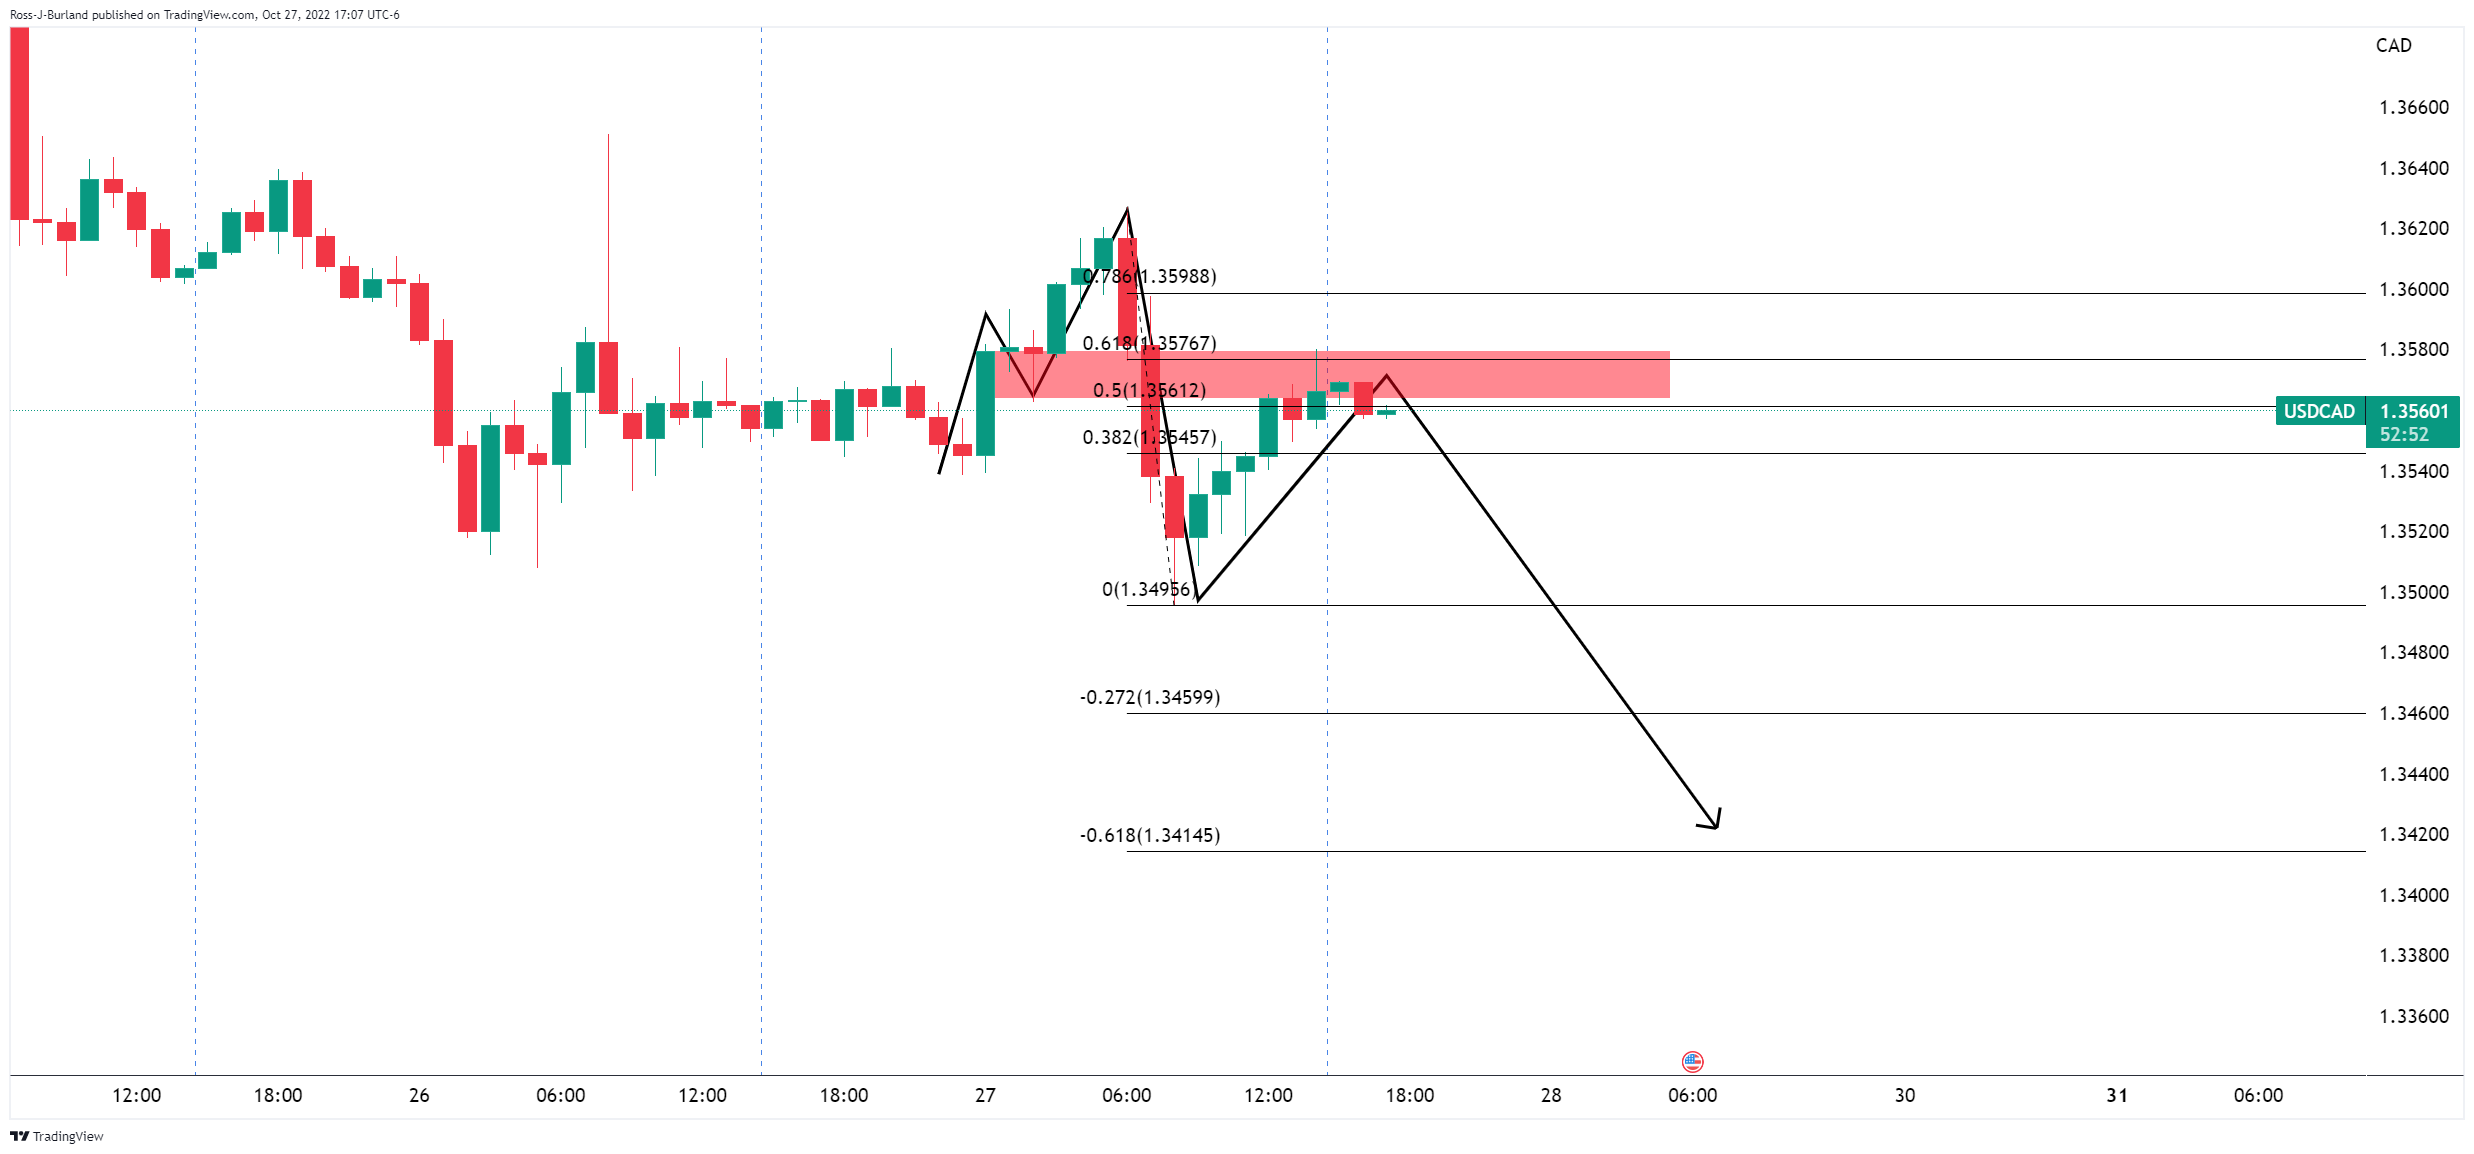
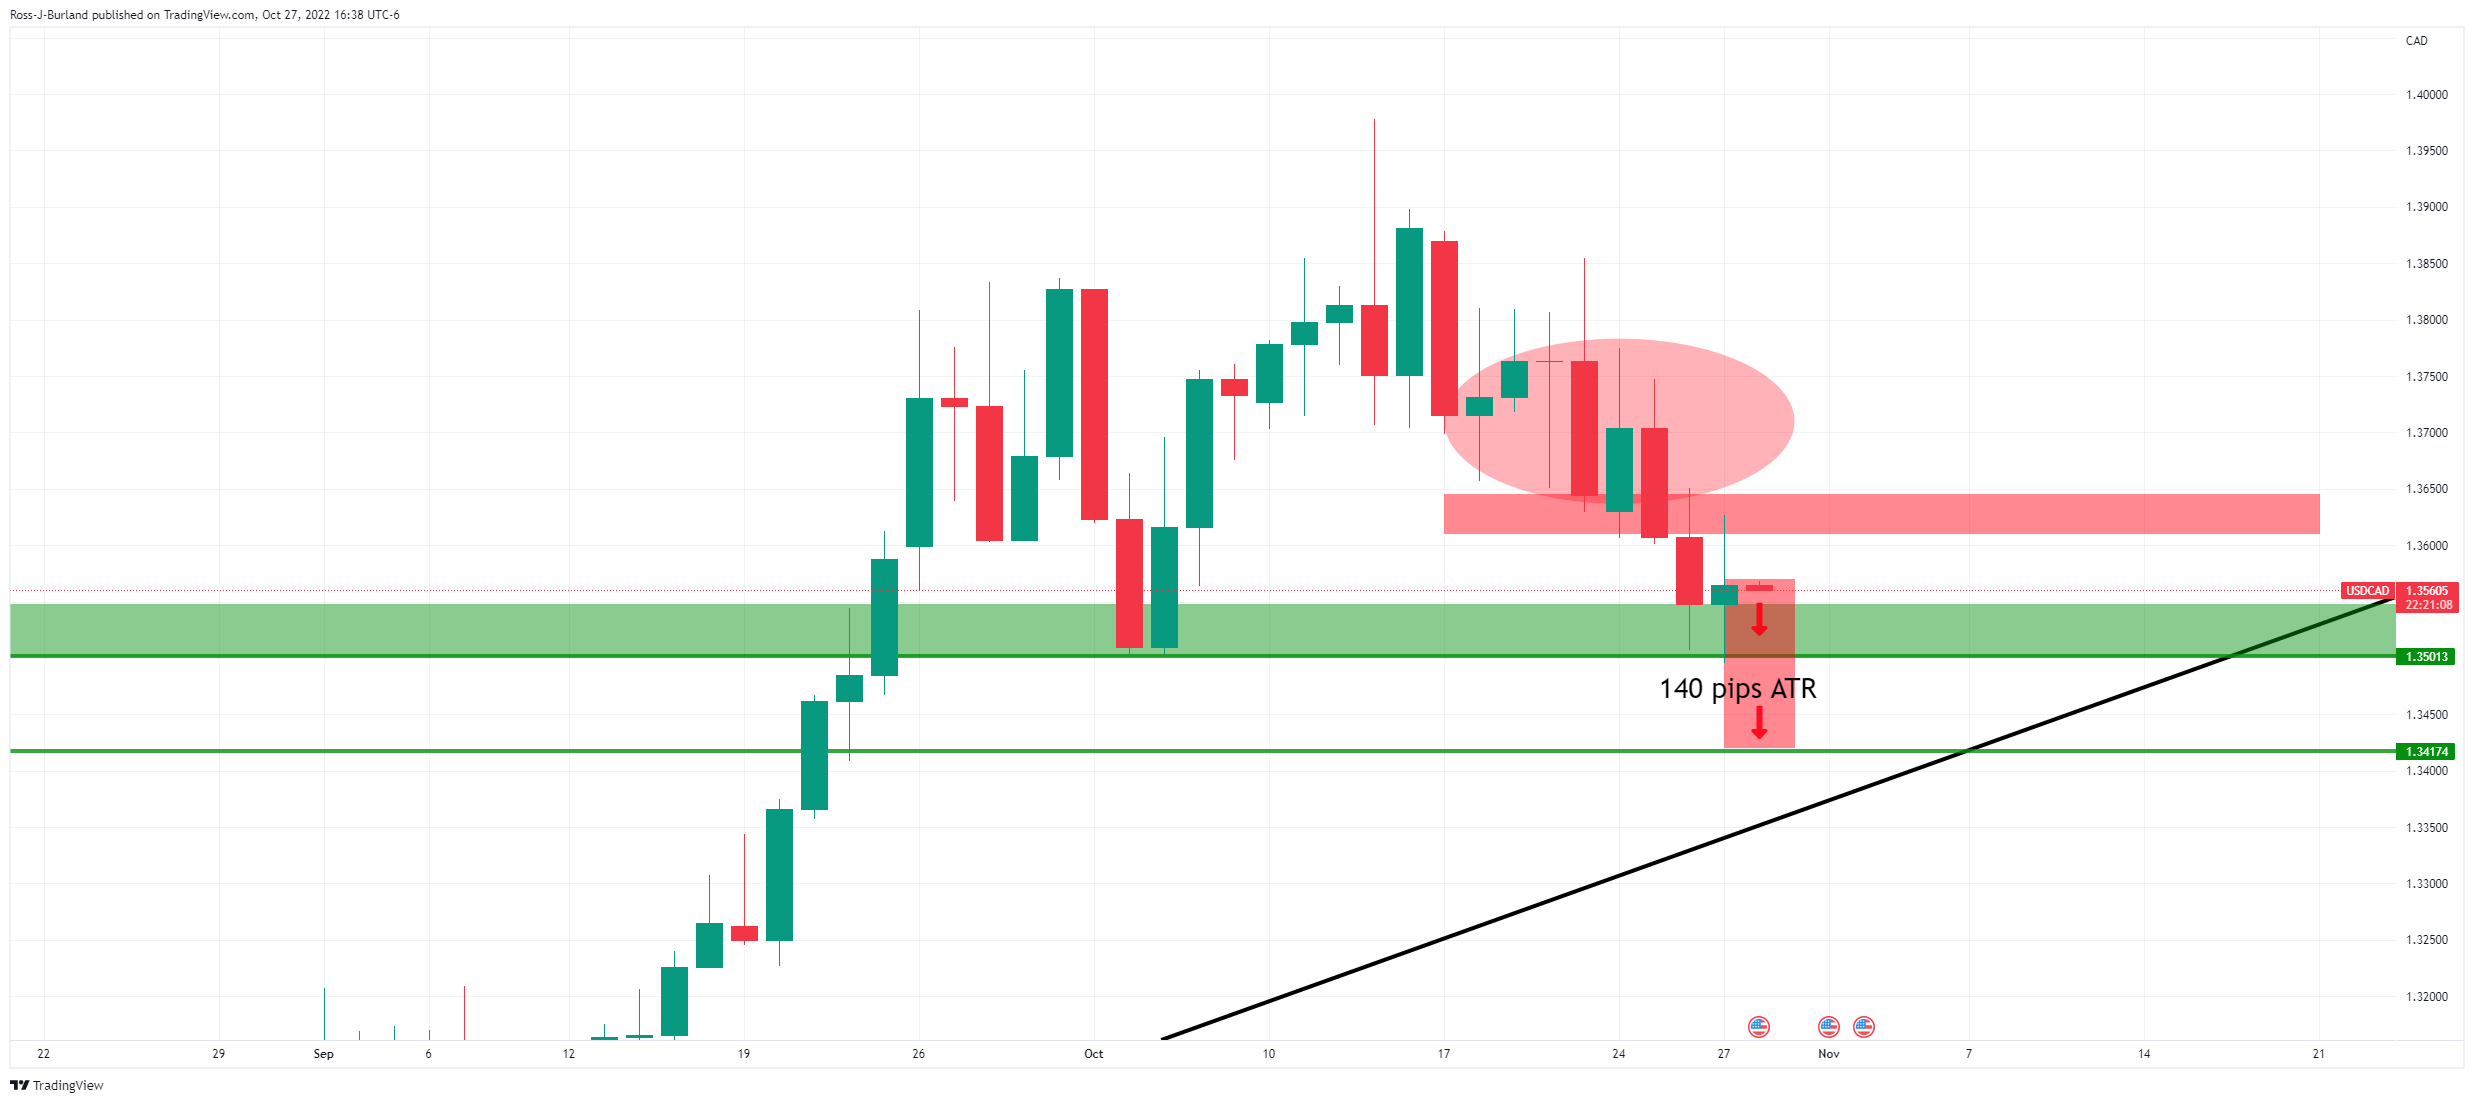
(H1 chart)
We have seen a steady correction into a 50% mean reversion of the bearish impulse and the neckline of the M-formation/resistance which leaves the path of least resistance to the downside now.