- GBP/USD Price Analysis: Further downside hinges on 1.1540 break
Market news
GBP/USD Price Analysis: Further downside hinges on 1.1540 break
- GBP/USD broker weekly support line but sellers attack one-month-old previous resistance.
- MACD, RSI suggests further downside towards 200-SMA support.
- Multiple hurdles stand tall to challenge buyers beyond monthly high.
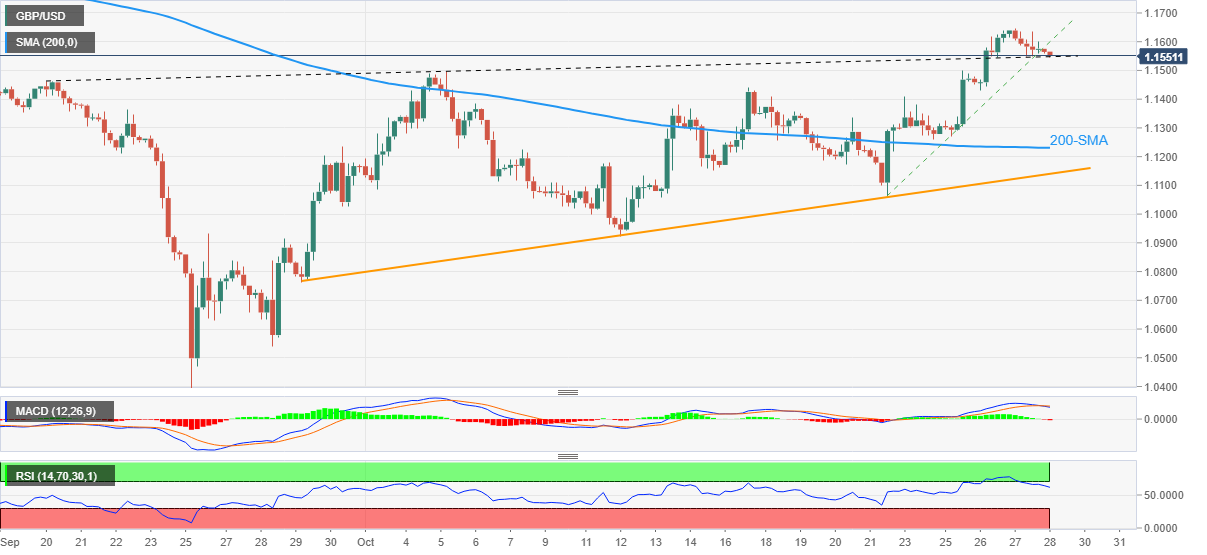
GBP/USD extend the previous day’s pullback from a six-week high, mildly offered at 1.1550 during Friday’s Asian session. In doing so, the cable pair sellers cheer the downside break of a weekly support line, now resistance, to jostle with the resistance-turned-support trend line from September 20.
Given the RSI’s retreat from the overbought territory, as well as the bearish MACD signals and the weekly support break, the GBP/USD pair is likely to extend the latest declines past the immediate support line, around 1.1540.
Following that, the mid-month peak near 1.1440 could act as a buffer during the quote’s likely slump toward the 200-SMA support close to 1.1230.
In a case where GBP/USD remains weak past 1.1230, an upward-sloping support line from September 29 around 1.1140 will be crucial to watch for further downside directions.
Alternatively, the recently broken support line, now resistance around 1.1600, guards immediate recovery of the GBP/USD prices ahead of challenging the monthly high of 1.1645.
It should be noted, however, that September’s top and lows marked during July, respectively near 1.1740 and 1.1760, will be tough challenges for the pair buyers past 1.1645.
GBP/USD: Four-hour chart
Trend: Further weakness expected