- Gold Price Forecast: XAU/USD aims to test a two-week low below $1,620 amid anxiety ahead of Fed policy
Market news
Gold Price Forecast: XAU/USD aims to test a two-week low below $1,620 amid anxiety ahead of Fed policy
- Gold price is declining towards a two-week low at $1,617.28 amid rising hawkish Fed bets.
- The DXY continued its upside journey as the risk profile sours amid Fed’s pre-anxiety.
- The Fed will hike interest rates by 75 bps in November and by 50bps in December.
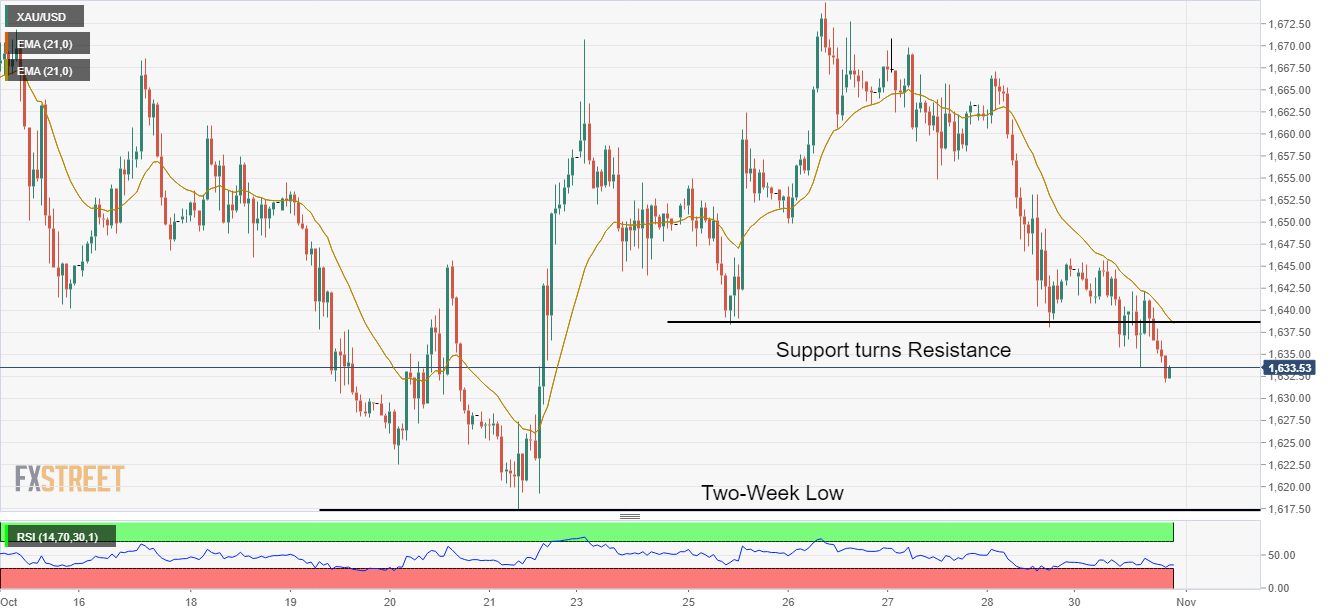
Gold price (XAU/USD) has witnessed a pullback move after dropping to near $1,632 in the early Tokyo session. The confidence seems to be lacking in the pullback move as the overall structure has become weak after the gold price surrendered the critical support of $1,638.00. The precious metal is declining toward a two-week low at $1,617.28 as the Federal Reserve (Fed) is set to tighten its policy further to combat rigid inflation.
Meanwhile, the US dollar index (DXY) extended its two-day winning streak on Monday after overstepping the critical hurdle of 111.00. Investors shifted to the risk aversion theme amid uncertainty ahead of the interest rate decision by the Fed. This also resulted in a sell-off in S&P500 and 10-year US Treasury yields flew higher to 4.05%.
As per the CME FedWatch tool, the chances of fourth consecutive 75 basis points (bps) rate hike stand at 86.5%. Analysts at Rabobank point out that with a Fed that is clearly prioritizing price stability over full employment, rates will go higher than currently anticipated. They expect a 75 bps rate hike in November and a 50 bps rate hike in December. And, the terminal rate would top around 5%.
Gold technical analysis
On an hourly scale, gold price has shifted into the bearish trajectory after surrendering the critical support of $1,638.00. The precious metal will test a two-week high at $1,617.28, recorded on October 21.
The 20-period Exponential Moving Average (EMA) at $1,638.00 is acting as major resistance for the counter. Meanwhile, the Relative Strength Index (RSI) (14) has shifted into the bearish range of 20.00-40.00, which indicates more weakness ahead.
Gold hourly chart
 .
.