- Silver Price Analysis: XAG/USD eases from multi-week high, strong rally stalls near 61.8% Fibo.
Market news
Silver Price Analysis: XAG/USD eases from multi-week high, strong rally stalls near 61.8% Fibo.
- Silver rallies to over a three-week high on Tuesday and taps the $20.00 psychological mark.
- The momentum confirms a bullish break through the 100 DMA/50% Fibo. confluence hurdle.
- Sustained weakness below the $19.00 mark is needed to negate the near-term positive outlook.
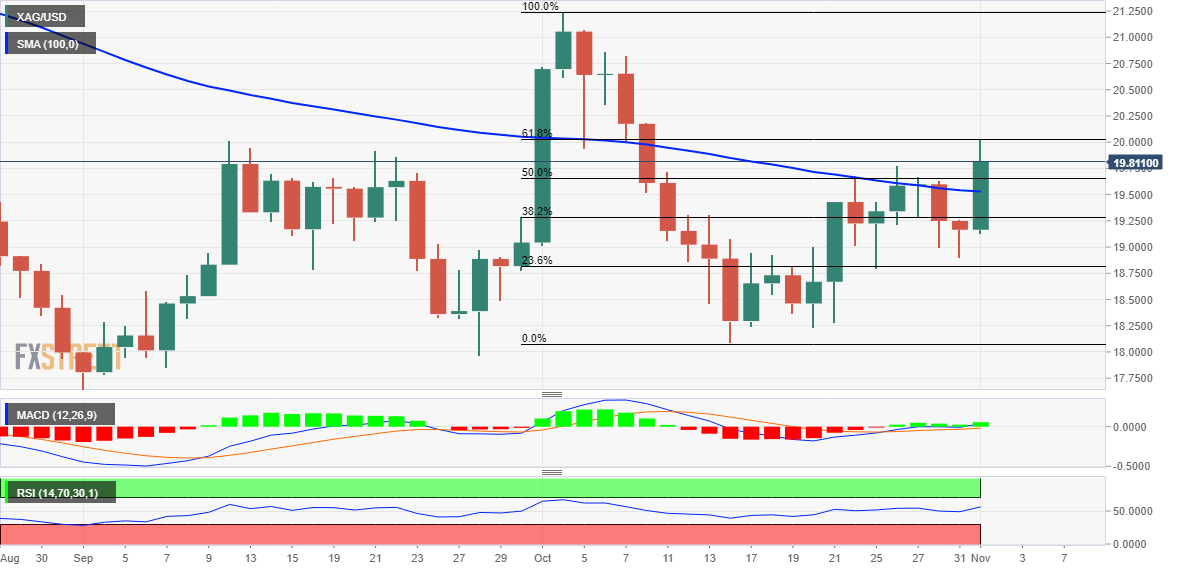
Silver catches aggressive bids on Tuesday and rallies to over a three-week high during the early North American session. The white metal is currently trading just below the $20.00 psychological mark, with bulls now awaiting sustained strength beyond the 61.8% Fibonacci retracement level of the recent fall from the October monthly swing high.
Looking at the broader picture, the strong intraday move-up confirms a fresh bullish breakout through the $19.55-$19.65 confluence hurdle. The said area comprises 50% Fibo. level and the 100-day SMA, which should now act as a strong near-term base and a key pivotal point to determine the next leg of a directional move for the XAG/USD.
Given that technical indicators on the daily chart have just started gaining positive traction, some follow-through buying will reaffirm the constructive set-up and pave the way for additional gains. The XAG/USD might then accelerate the momentum towards an intermediate resistance near the $20.50 zone en route to the $21.00 round-figure mark.
On the flip side, the $19.65-$19.55 resistance breakpoint is likely to protect the immediate downside. Any further decline might continue to attract some buyers near the $19.00-$18.90 support, marking the 23.6% Fibo. level. A convincing break below the latter will shift the bias in favour of bearish traders and make the XAG/USD vulnerable.
The subsequent downfall could get extended and drag spot prices towards the next relevant support near the $18.30-$18.25 region. This is closely followed by the $18.00 round-figure mark, which if broken decisively will expose the YTD low, around the $17.55 zone touched in September.
Silver daily chart
Key levels to watch