- Silver Price Analysis: XAG/USD holds above 100-day SMA pivotal support near mid-$19.00s
Market news
Silver Price Analysis: XAG/USD holds above 100-day SMA pivotal support near mid-$19.00s
- Silver finds some support near 100-day SMA, though struggles to attract any buyers.
- The setup still favours bullish traders and supports prospects for additional gains.
- A sustained break below the $19.00 mark is needed to negate the positive outlook.
Silver struggles to gain any meaningful traction on Wednesday and remains confined in a narrow trading band above the mid-$19.00s through the early European session.
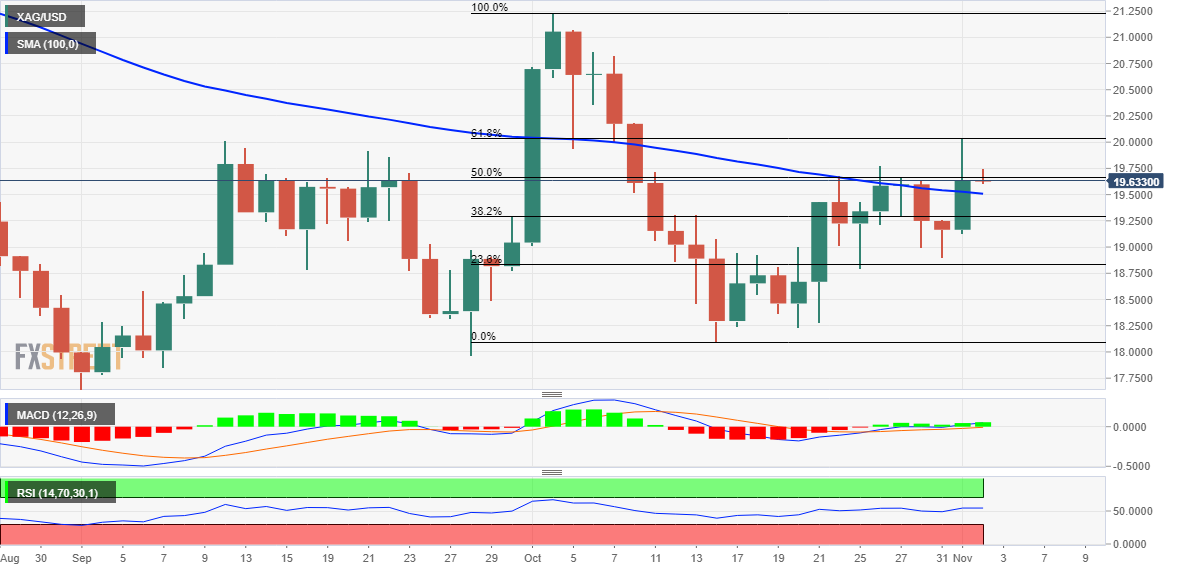
From a technical perspective, the overnight retracement slide from the $20.00 psychological mark stalls near the 100-day SMA. The said support coincides with the 50% Fibonacci retracement level of the recent fall from the October monthly swing high and should act as a pivotal point for the XAG/USD.
Given the overnight breakout through the aforementioned confluence barrier, the technical set-up seems tilted firmly in favour of bullish traders. Moreover, oscillators on the daily chart have just started moving into positive territory and support prospects for a further appreciating move. Hence, a fresh attempt towards conquering the $20.00 round figure, also marking the 61.8% Fibo. level, looks like a distinct possibility. Some follow-through buying has the potential to lift the XAG/USD further towards an intermediate resistance near the $20.50 region en route to the $21.00 mark.
On the flip side, weakness below the mid-$19.00s (100 DMA) might continue to attract some buyers near the $19.00-$18.90 support zone, representing the 23.6% Fibo. level. A convincing break below the latter will shift the near-term bias in favour of bearish traders and make the XAG/USD vulnerable. The subsequent downward trajectory could then drag the XAG/USD towards the next relevant support near the $18.30-$18.25 region. This is closely followed by the $18.00 round-figure mark, below which spot prices could aim to challenge the YTD low, around the $17.55 area touched in September.
Silver daily chart
Key levels to watch